
Imagine the monthly portfolio report. An analyst exports occupancy from the property management system (PMS), costs from accounting, and budgets from the construction platform, joins them in Excel, and saves the result as this month’s file. Next month the same joins are rebuilt from scratch, and last quarter’s figures sit in another file built with slightly different logic.
Each system is doing its job. What’s missing is one place where data from all of them is combined, kept over time, and reused by every report. The five steps of real estate data consolidation below explain how to build that layer, what each stage should produce, and what your team needs to prepare.
What Is Real Estate Data Consolidation?
Real estate data consolidation is the process of bringing asset data from the systems a company uses into one shared, usable structure: collected, standardized, stored centrally, and kept current.
Several related terms are often used interchangeably, but each covers a different part of the work:
- Data integration: connecting systems and moving data between them.
- Data normalization: bringing values, formats, and identifiers in line with agreed rules.
- Data consolidation: the overall process, which uses integration and normalization along the way.
- Single source of truth: the result of shared data, agreed definitions, and clear ownership working together. A central database alone doesn’t create one.
Consolidation is the part of real estate data enablement that produces this shared layer. Enrichment, reporting, AI, and automation build on it.
How to Consolidate Real Estate Data in 5 Steps
ORIL typically follows these five steps in real estate data projects, adapting the scope and sequence to each company’s systems and goals. In most projects, each step builds on the output of the one before it.
1.Collection: account for each source and bring available data into a working area.
2.Normalization: fit each source into one consolidated model, with stable IDs at the right entity level.
3.Central storage: keep consolidated data and its history in a shared repository with controlled access.
4.Refresh automation: keep the repository current, with agreed “as of” points across sources and reprocessing of backdated changes.
5.First dashboards, then AI: validate priority reports or use cases before expanding AI that depends on those metrics.
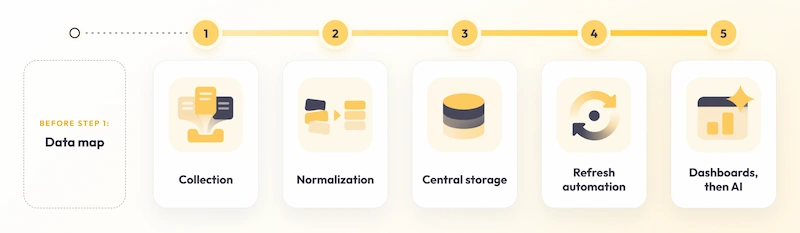
Most projects also benefit from one piece of preparation before Step 1.
Before Step 1: Build a Data Map Before a Tool Shortlist
A real estate data map lists the systems and files that hold asset data and records what consolidation needs to know about each one: which entities it holds (property, building, unit, lease), how much history it keeps, which fields it can be trusted for, and who owns it.
At ORIL, data projects usually start with a data map, because a team can only consolidate the sources it has found. The map names a data owner for each source: the person accountable for what that source’s data means.
A simple way to track discovery is to give each source a status, for example:
- Known: confirmed to exist and accessible.
- Assumed: believed to exist or to be accurate, but not yet checked.
- Unknown: a gap the team suspects but can’t locate yet.
Assumed and unknown sources are common blind spots during discovery. Hidden data tends to sit with contractors, on personal drives, or in trackers no system formally owns.
Illustrative data map. Sources and values are examples, not real data.
| Source | Owner | Entity level | History kept | Trusted for | Status |
| Property management system | Operations | Unit, lease | Several years | Occupancy, lease terms | Known |
| Construction management platform | Development | Project, property | Since platform launch | Budgets, change orders | Known |
| Finance cost tracker (Excel) | Finance | Property | Current year only | Capex | Assumed |
| SharePoint project folders | Development | Building | Unclear | Handover documents | Assumed |
| Contractor files | Not assigned | Building | Unknown | Site reports | Unknown |
Where possible, choose the architecture after mapping the data sources. A decision made before discovery may overlook files, contractor records, or access restrictions that affect what the solution needs to support.
Step 1. Collection: Retrieve Data From the Mapped Sources
The data map records what exists, and collection retrieves it. For consolidation, retrieval usually follows this order:
- An initial load brings in the history the priority reports need.
- Collected data lands in a staging area unchanged, as a raw copy of each source, so every consolidated figure can be traced back to what the source said.
- An incremental pass picks up new and changed records from then on.
- A collection log records what came in from each source, how much history, and what is still incomplete.
Property data integration covers how each source is connected. The methods and their tradeoffs are covered in our guide to connecting PMS, ERP, CRM, and other systems.
Typically, IT provides access and plans the [real estate data integration] work for sources that need a lasting connection, while the data owner of each source confirms what the collected data means.
Step 2. Normalization: Fit Every Source Into One Consolidated Model
Normalization is where collected data is reshaped to fit one consolidated model: the shared structure every report reads from.
Matching records and standardizing values across sources is the mechanical core of this step, and reconciling inconsistent real estate data explains how matching, normalization, and source priority work. For consolidation, the larger design decision is the model itself: which entities it holds, how they relate, and which source each field comes from.
Illustrative consolidated model. Entities and sources are examples.
| Entity | Identified by | Belongs to | Main source of record |
| Portfolio | Portfolio ID | Top level | Asset register |
| Property | Property ID | Portfolio | Asset register |
| Building | Building ID | Property | Asset register |
| Unit | Unit ID | Building | PMS |
| Lease | Lease ID | Unit | PMS |
| Budget and cost lines | Cost line ID | Property or project | Accounting, construction platform |
Real estate data normalization then maps each source into that model. Source IDs map to a stable ID at the right level, and the relationships between levels are kept, so a unit-level occupancy figure rolls up to its building, property, and portfolio without being counted twice.
Data owners and business area leads agree on definitions, exceptions, and which source takes precedence when records conflict. Those decisions are documented with the model, so reports and later workflows read the consolidated data the same way.
Step 3. Central Storage: One Shared Repository for Asset Data
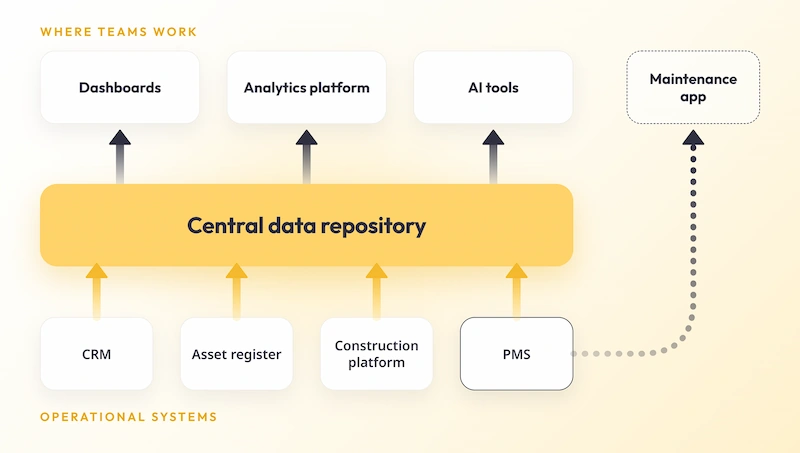
A central data repository stores consolidated asset data in one governed location. IT or an engineering partner usually sets it up and runs it, and teams reach the information they need through approved reporting tools, applications, or queries, with access set by role and confirmed by data owners.
For cross-system reporting, such as comparing occupancy with construction costs, the repository can provide a shared dataset for a real estate analytics platform.
History is what sets a consolidated repository apart from a live connection to each system. Source systems often overwrite values: a PMS shows today’s occupancy, not last March’s. The repository can keep period snapshots, for example at each month-end close, so a report for last quarter returns the same figures every time it runs and trend lines compare like with like.
Many repositories also keep two layers: the raw staging copy from Step 1 and the consolidated model from Step 2. When a rule changes, the team can rebuild the consolidated layer from the raw copy without collecting everything again.
Step 4. Refresh Automation: Keep the Data Current
Refresh automation uses data pipelines to update the central repository on an agreed schedule. A data pipeline is an automated process that takes data from a source, applies the normalization rules, and loads the result into the repository.
For consolidation, the harder question is timing across sources. The PMS may update daily, while accounting closes the month a week later and may still post adjustments after that. Combined reports need an agreed “as of” point for each source, so a month-end report doesn’t mix closed financials with partly updated occupancy.
Two refresh patterns usually work together:
- Incremental loads: pick up new and changed records since the last run.
- Reprocessing: rebuilds affected periods when a source posts a backdated change, such as a corrected lease start date or a late accounting adjustment.
Data consolidation is ongoing work. New properties join the portfolio, systems get upgraded, and fields get renamed, so ongoing real estate data management keeps the pipelines and the model in step with those changes. Late or failed updates should be flagged to the team running the pipelines and the affected data owner, so incomplete periods are caught before reports use them.
Step 5. First Dashboards, Then AI
Validate the data and business definitions against a few priority reports or use cases before expanding AI capabilities. Dashboards are a practical starting point, though a narrowly scoped AI pilot with its own checks can start earlier.
Return to the monthly report from the introduction. Once it reads from the repository, the joins are built once, and asset management and operations compare occupancy using the same documented definition.
Before teams switch, the consolidated figures are reconciled against each source’s own reports. A mismatch often points to a mapping rule, a timing difference between sources, or a definition the teams haven’t agreed on yet, and each needs a different fix.
For a cycle or two, the old spreadsheet and the new dashboard run side by side. The spreadsheet is retired once:
- Closed-month rent totals match the PMS rent roll for the same month
- Cost totals match accounting for the same close period
- Every remaining difference has an explanation or a logged fix
For real estate data visualization, start with the three or four reports leadership relies on most, with business area leads as the first users.
AI can produce confident but incorrect answers when its data is inconsistent or its metric definitions are unclear, which is why AI use cases scale only after this step.
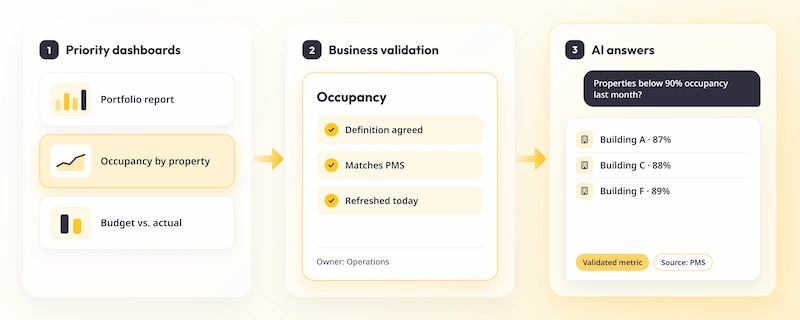
From there, AI enablement builds on the same data and definitions.
What It Takes: Who to Involve and What to Prepare
A consolidation project usually involves the data owner of each main source and the leads of each business area that uses the data.
When the project follows an acquisition, the same roles are needed on a tighter timeline, and post-acquisition data consolidation adds a second set of systems and IDs to reconcile.
What you can start preparing this week:
- A list of known and suspected systems and files, including spreadsheets and contractor data
- A named owner for each source
- Access to each system, or sample exports where access takes longer
- The reports leadership wants reproduced first, including the past periods they compare against
- The month-end close dates for finance and any other source that closes periods
- Terms that already cause confusion between teams, such as how each team defines “occupancy” or “vacant”
The setup itself depends on each company’s systems, access constraints, and goals.
Start With a Clear View of Your Real Estate Data
Real estate data consolidation gives analytics and AI projects a foundation they can reuse, so each new initiative starts from data the company already understands.
ORIL builds that foundation as engineering work: the data model, pipelines, and software that keep property data usable as the portfolio and its systems change.


