

The forecasting model is often the smaller part of the job. In production, what makes predictive analytics in real estate reliable is the infrastructure around it: governed historical data, unified business entities, feature pipelines, model serving, monitoring, and integration into the systems where people work.
Predictive analytics in real estate uses historical and current business data to estimate future outcomes: transaction volume, pipeline conversion, commission revenue, occupancy, and pricing direction. It is distinct from historical reporting, which describes what already happened, and from property valuation, which estimates a single asset’s current worth.
This is where predictive analytics becomes an engineering problem: building the data architecture and production software that turns a real estate company’s historical record into forecasts it can act on. This article covers what you can forecast, what data and architecture that requires, and when custom development is the right call.

Why Historical Reporting Is No Longer Enough for Real Estate Decision-Making
Historical reporting answers one question well: what happened. A monthly dashboard shows closed deals, realized commissions, current occupancy, and average price.
That record is necessary, and for compliance and board reporting it is often enough. It runs into limits the moment a decision depends on what comes next.
| Dimension | Historical reporting | Forecasting |
| Question it answers | What already happened | What is likely to happen next |
| Time orientation | Backward-looking | Forward-looking, over a defined horizon |
| Typical output | A fixed number | An estimate with a confidence range |
| Update cadence | Periodic (monthly or quarterly) | Scheduled or continuously refreshed |
| Where it usually lives | BI/reporting layer | Analytics, operational systems, and product workflows |
The gap shows up in the questions a reporting dashboard cannot answer:
- How many deals are likely to close next month, and does current staffing match the pipeline forming behind them?
- Which open deals are most at risk of slipping, and where should a manager step in first?
- How will occupancy move as the lease expirations clustered in the next two quarters come due?
Why Reliable Forecasting Is an Infrastructure Problem
Much of the forecasting that fills this gap still runs in spreadsheets or in analyst-built models that sit outside the operational systems. Those approaches tend to share the same weaknesses:
- Hard to reproduce. The logic lives in one analyst’s file rather than a system.
- Slow to update. New data means manual re-exports and rework.
- Hard to validate. There is no clean record of forecast versus actual outcomes.
- Fragile ownership. When the analyst who built the model leaves, the forecast often leaves with them.
Getting past those limits is why teams weigh whether a custom real estate analytics platform fits their product strategy rather than adding another export to the reporting layer.
A forecast that updates continuously also belongs closer to the product than to a BI tool, in data-native real estate platforms designed for constant data flow.
Real estate firms are already moving in this direction. In Deloitte’s 2026 Commercial Real Estate Outlook, 27% of surveyed firms reported challenges with AI implementation, including technical issues and gaps in expertise, and 19% placed themselves in the early stages of their AI journey. Deloitte’s read is that turning AI investment into results depends on reliable, application-ready data rather than on the model alone.
From Descriptive to Predictive Forecasting
Analytics maturity tends to move through stages:
- Descriptive answers what happened (closings, occupancy, revenue).
- Diagnostic answers why it happened (which segments, sources, or markets drove the change).
- Predictive estimates what is likely to happen next, with a time horizon and a range.
Predictive analytics adds a forward-looking target, a defined forecast horizon, and a measured estimate of uncertainty. In production, those forecasts can also be refreshed as new data arrives, though the cadence can be scheduled rather than constant.
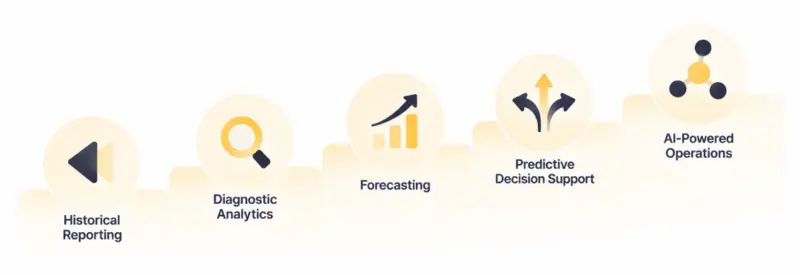
A forecast is not a fixed number. It is a moving estimate that should improve, or at least stay honest, as reality feeds back into it.
Six Real Estate Outcomes Companies Can Forecast
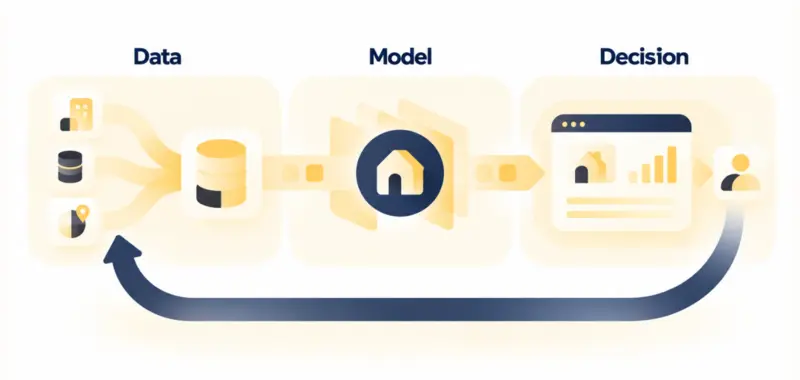
The same pattern repeats across most useful forecasts: relevant historical data becomes engineered inputs, a model turns those inputs into an estimate, and that estimate drives a decision. Six outcomes cover most of what operators, brokerages, and investment teams need.
Predicting pipeline health and future revenue also lets teams move toward real estate operations automation, where forecasts trigger workflows instead of only informing a report.
Transaction Volume
Forecasting how many transactions will close over a coming period, segmented by market, office, team, or agent. Key inputs include:
- Historical closings and seasonality
- Current pipeline and lead volume
- Conversion rates and average time-to-close
The output supports staffing, capacity, and revenue planning. The engineering challenge is consistency: closings recorded differently across offices or systems can produce a forecast that looks precise but is quietly wrong.
Pipeline Health and Future Closings
Counting open opportunities is reporting. Forecasting which of them will close, and when, is prediction.
Models weigh pipeline stage, deal age, velocity, lead source, agent activity, historical conversion by stage, and expected close date to estimate closing probability and expected future closings. That lets teams intervene on stalling deals rather than discovering the shortfall at month end.
Commission and Transaction Revenue
A transaction forecast becomes a revenue forecast once you apply deal value, closing probability, expected close date, and commission structure, including splits and historical cancellation rates. The result is a probability-weighted projection rather than a best-case pipeline total. This is where forecasting connects directly to financial and hiring plans.
Occupancy and Vacancy
For property operators, occupancy forecasting draws on:
- Occupancy history and vacancy duration
- Lease expiration schedules and renewal behavior
- Leasing velocity and seasonality
These combine into projected occupancy and renewal probability. Forecasting expirations and likely renewals months ahead turns leasing into a planned activity instead of a response to current vacancy.
Pricing and Rental Rates
A forecast of pricing direction or a likely range can draw on:
- Historical prices and rents
- Inventory, demand signals, and concessions
- Seasonality and comparable properties
This differs from an automated valuation model (AVM), which estimates a single property’s current value. Rate forecasting projects where pricing is heading across a segment, which informs revenue and renewal strategy.
Portfolio Income and Cash Flow
For firms holding real estate, the outcomes above roll up into a forward view of financial performance. Combining forecasts across the portfolio supports projections for:
- Projected NOI and rental income
- Operating expenses and debt service
- Vacancy and lease rollover
These feed budgeting, distributions, and acquisition or disposition timing. This is the layer where operational forecasts become an input to investment and financial planning rather than a set of separate reports.

What Data Makes Real Estate Forecasting Possible?
All six forecasts draw on an overlapping data foundation:
- Transactions and commissions from transaction management and accounting systems
- CRM and pipeline activity, stages, and lead sources
- Listings and market data from MLS (Multiple Listing Service) feeds and third parties
- Property, lease, and occupancy records from the PMS (property management system)
- External signals such as public records and economic indicators, where relevant
Forecast quality depends less on any single source than on how well these connect. The variables that matter most are historical depth (enough past to learn seasonality and cycles), granularity (per deal, per unit, per market), freshness, reliable timestamps, and consistent identifiers so the same property, agent, or deal resolves across systems.
That last point is where many initiatives slow down. Teams usually need to audit their real estate data foundations before models are worth building.
Data Quality and Feature Engineering: Turning Business Data into Forecasting Signals
Raw operational data is rarely in a form a model can use. The preparation layer between the two, feature engineering, is often where forecast accuracy is won or lost. It typically includes:
- Normalizing values and resolving entities so records line up across systems
- Handling missing and duplicate records
- Deriving time-based features: seasonality, rolling averages, lag variables
- Computing conversion rates, pipeline velocity, and time-to-close
- Encoding property and market segmentation
Skipping this layer tends to produce structural data debt in PropTech, which quietly inflates error margins in any downstream model.
Multi-market forecasting adds a further step. External listing and transaction feeds vary by market, so generating comparable signals across markets depends on MLS data normalization to align differing schemas before any feature is computed.
How Forecasting Models Turn Historical Data into Future Estimates
Different targets call for different modeling approaches, and matching the two matters more than picking any single algorithm:
- Time-series methods suit volume, occupancy, and pricing, where seasonality and trend dominate.
- Classification or probability models suit closing likelihood, where the question is whether an event happens.
- Regression and gradient-boosting methods suit continuous outcomes like expected revenue from many inputs.
Two design choices shape every real estate forecast.
The first is horizon: a next-week pipeline estimate and a next-year occupancy projection are different problems with different accuracy expectations.
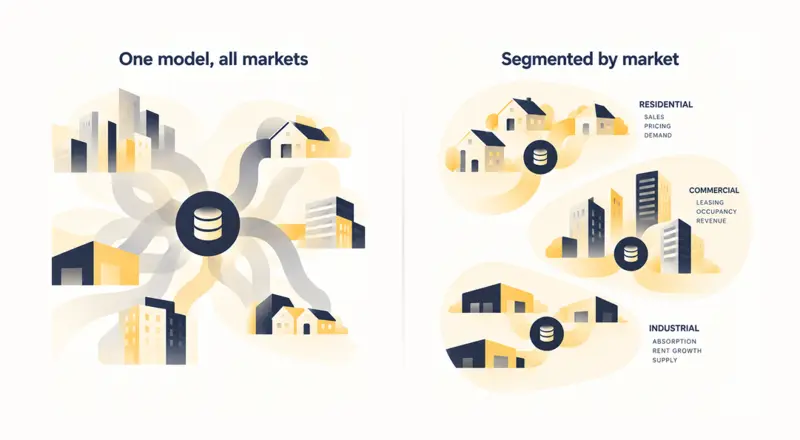
The second is segmentation: one national model rarely serves materially different markets well, so segmenting by market, asset type, or team usually improves results.
Practical forecasting also treats uncertainty as part of the output. A responsible forecast carries a range, not only a point, so decisions account for how wide the plausible outcomes are. Reading how practitioners describe real production systems, rather than demos, is a useful reality check on what AI in real estate actually requires.
How to Validate Forecast Accuracy Before Using It for Business Decisions
A forecast earns trust through measurement. Standard practice:
- Backtesting against held-out historical periods the model did not train on
- Baseline comparison against a simple benchmark (last period, seasonal average)
- Error metrics such as MAE (mean absolute error), RMSE (root mean square error), and MAPE (mean absolute percentage error), chosen to fit the decision
- Forecast-vs-actual tracking by segment and horizon, since accuracy is rarely uniform
What counts as good accuracy depends on the decision. A staffing forecast can tolerate a wider margin than a commission projection feeding a financial plan.
Data availability sets the ceiling in either case. As one public illustration, Zillow‘s residential Zestimate reports a nationwide median error of 1.78% for active listings but 7.20% for off-market homes, where recent comparable data is thinner, and notes accuracy varies with location and data availability. The operational forecasts above behave the same way in principle, not at the same error rates, which is why each is measured by segment and horizon rather than against one fixed target.
Establishing error tolerances and backtesting protocols before deployment is also what keeps model-driven estimates aligned with reliable property valuations once they reach production workflows.
From Forecasting Model to Production Analytics Platform
A model in a notebook is an experiment. A forecast the business depends on is a production system with several moving parts:
- Automated ingestion pulls new data from source systems on a schedule or on events.
- A centralized data platform stores governed historical and current data.
- Feature pipelines rebuild model inputs as data changes.
- The model generates predictions.
- A prediction service exposes those predictions through an API.
- Dashboards and operational applications consume them.
- Actual outcomes flow back into the platform for forecast evaluation, model monitoring, and when appropriate, retraining.
Connecting live CRM, PMS, and MLS streams is what turns that flow into a system people can rely on, which makes it worth auditing customer integration dependencies early so a single upstream change does not silently break the forecast.
Making Forecasts Actionable Across Real Estate Systems
A prediction trapped in a static report rarely changes behavior. Value appears when forecasts reach the systems and views where people act: an at-risk deal flagged in the CRM, a predicted occupancy dip surfaced in the property management tool, a revenue projection updated in the planning system.
For investment firms holding real estate, that action layer is usually a portfolio view. A forecast earns its keep when an asset or portfolio manager can see projected occupancy, rent, and income across every asset at a glance, drill into a single property, and compare scenarios side by side, which is where real estate data visualization does the work.
Getting a prediction in front of the right person at the right moment is an integration problem: pushing forecasts into the CRM, PMS, and planning tools through the same pipelines that feed them. Done well, a forecast becomes a prompt to act.
Keeping Forecasting Systems Reliable Over Time
Markets move, business rules change, and pipelines can fail quietly. Ongoing reliability depends on:
- Forecast-vs-actual monitoring to catch accuracy decay early
- Detecting data drift (inputs change) and model drift (relationships change)
- Alerting on failed or delayed pipelines
- Model versioning and defined retraining triggers
Without this, a model that performed well at launch can drift until people stop trusting it, sometimes right when a shifting market makes the forecast most valuable.
Common Implementation Mistakes in Real Estate Forecasting
A few recurring issues undermine forecasting initiatives more than model choice does:
- Data leakage. Information that would not be available at prediction time slips into training, so the model looks accurate in testing and fails in production.
- Too little history. Without a long enough record, the model never sees a full seasonal cycle or market downturn, so its estimates hold only until conditions change.
- No confidence range. Shipping a single number with no stated uncertainty invites teams to treat an estimate as a fact and over-commit to it.
- No baseline. Skipping a simple benchmark leaves no way to tell whether the model actually beats last year’s average or a seasonal naive forecast.
Several of these trace back to unclear requirements rather than technical error. Grounding a forecasting project in business analysis for PropTech keeps model outputs tied to the commercial decisions they are meant to support.
When Custom Predictive Analytics Software Makes Sense
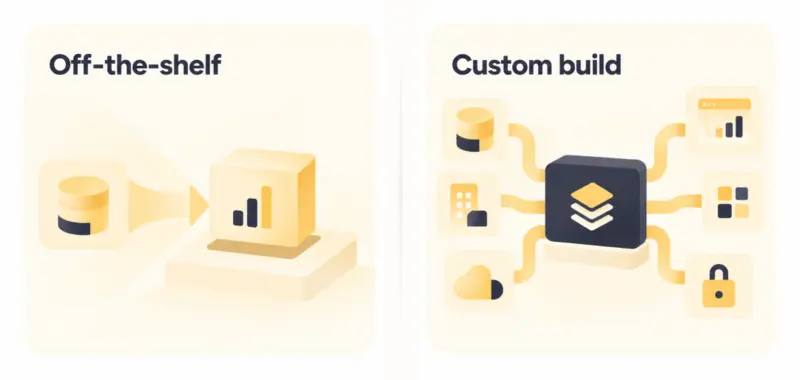
Off-the-shelf forecasting tools are a reasonable starting point when the need is standard, the data is clean and centralized, and the outputs can live in a separate dashboard. Many teams should begin there.
Custom development tends to be justified when several of these are true:
- Forecasts depend on proprietary business data and definitions
- Data lives across multiple disconnected systems
- The business tracks unique KPIs or non-standard forecast horizons
- Predictions need to be embedded inside existing customer or operational software
- The team needs ownership and control of the data and analytics architecture
When packaged BI tools cannot accommodate custom models or complex pipelines, that is the point to revisit build vs buy decisions against actual technical requirements.
From Forecasting Model to Production Platform: How ORIL Builds It
Building a forecasting platform draws on a broader software development capability that spans discovery, design, build, integration, and long-term support. The pieces most relevant to it map directly to the production flow above:
- Data integration that unifies fragmented listing, CRM, PMS, and transaction feeds into a model-ready warehouse, through specialized real estate data integration.
- Analytics and data platforms built to scale as transactional volume and data complexity grow, drawing on analytics and data platforms built for production.
- Forecasting and ML services, APIs, visualization layers, and monitoring, delivered through AI enablement and development that connects models to real workflows.
Built well, this infrastructure is reusable. The same data platform, feature pipelines, and serving layer that support transaction forecasting also support the next AI capability a team wants, which is often where the longer-term return sits.
The Business Value of Reliable Forecasting
The value of forecasting shows up as earlier, steadier decisions across the business. A brokerage can size staffing and capacity to the transactions likely to close rather than only the ones already booked. Sales leaders can step in on a slipping pipeline while there is still time to change the outcome, and finance can plan against probability-weighted commissions instead of a best-case total.
For firms holding real estate, projected occupancy and rent movements inform renewal, pricing, and acquisition decisions before vacancies or softening rates show up in the numbers.
The prediction is only the starting point. What changes outcomes is acting on it earlier, and doing so consistently, cycle after cycle.
The durable advantage builds from there: once actual outcomes feed back into the platform, each forecast cycle can sharpen the next, and the accumulated, well-governed historical data becomes an asset that is difficult for competitors to reproduce quickly.
The years of clean, connected operational history behind a model are harder to reproduce than the model itself, and that compounding data advantage is what separates a forecasting feature from a forecasting capability.


