

Most real estate and PropTech teams don’t struggle to see the value of analytics. They struggle to decide how far to go to get it. Do you build a real estate analytics platform from the ground up, or layer dashboards on top of the systems you already run?
This is an expensive decision to get wrong. Built well, a custom platform becomes the backbone of how your company prices assets, prioritizes a portfolio, and reports to investors. Built without a clear reason, it turns into a multi-quarter project that ships late, costs more than the tools it replaced, and never earns back its budget.
At ORIL, we combine expertise in real estate, data platforms, and SaaS products to help teams answer that question honestly.
This guide covers what a real estate analytics platform actually does, when a ground-up build is justified, what it costs in time and risk, and when a lighter path is the smarter move. If you want the wider context first, PropTech & Real Estate 2026: What’s Actually Changing covers the trends pushing teams toward more serious data and decision systems.
What a Real Estate Analytics Platform Actually Does
A real estate analytics platform pulls data from many sources into one place, then turns it into decisions people can act on. The value isn’t the dashboard on top. It’s the answer underneath it: what to buy, hold, sell, renew, or reprice, and why.
In practice, most enterprise real estate analytics platforms are built on top of a dedicated data platform that handles ingestion, storage, normalization, and governance. Analytics is the layer that turns that foundation into business decisions.
Done well, it unifies property, market, operational, financial, and tenant data into a single, trusted view. Underneath, three things have to work together:
- Ingest. Pulling data from MLS feeds, property and market data providers, your CRM, and your PMS or ERP, on a schedule you can trust.
- Standardize. Mapping everything into one data model, so a “unit,” a “property,” and a “deal” mean the same thing across every source. This is where most of the hidden work lives.
- Serve. Exposing it back as portfolio analytics, KPIs, dashboards, alerts, and increasingly natural language queries against your own data.
Once that foundation is in place, a good platform lets a team:
- Track portfolio performance across assets, funds, or markets without manual roll-ups.
- Compare assets side by side on consistent definitions of yield, occupancy, and cost.
- Analyze rent rolls and cash flows, and see where NOI actually comes from.
- Follow the pipeline and deal stages, so nothing stalls unnoticed.
- Forecast occupancy and revenue instead of reacting to them after the fact.
- Benchmark assets against the market using external property and market data.
- Get alerted to anomalies: a vacancy spike, overdue tasks, or a pricing gap versus comparable listings.
A BI tool like Power BI or Tableau visualizes whatever semantic model you provide. It doesn’t understand real estate concepts until your organization defines them. You build that meaning in yourself. A PMS or CRM runs your operations well but is built to process transactions, not to reason across them. A real estate analytics platform sits above both, carrying domain-specific metrics, workflows, and decisions, so the output is “which three assets are underperforming and why.”
What makes it hard in real estate is the data itself: fragmented, regional, inconsistently formatted, and often stale by the time it reaches a report. A platform earns its keep by absorbing that mess once, so every downstream decision runs on the same clean numbers.
Why Companies Consider Building a Real Estate Analytics Platform From the Ground Up
Ground-up development is a big commitment, so companies rarely consider it by accident. They reach for it because the alternatives have quietly stopped working.
The reporting analyst spends two days a month reconciling spreadsheets. The MLS export doesn’t line up with the CRM. Nobody can answer “which markets are softening?” without a week of manual work.
When teams do decide to build, it usually comes down to one or more of these reasons:
- Off-the-shelf tools feel too generic. The team ends up reshaping its own workflows to fit the software, instead of the other way around.
- The data model is genuinely complex. Operating across multiple markets or asset classes means one unified model has to reconcile things that don’t naturally line up.
- Integration is the whole problem. Several MLS feeds, property data APIs, CRM, PMS, ERP, IoT devices, and internal tools all have to meet in one place, and standard software handles that badly, if at all.
- Analytics is meant to become a product. There’s a plan to productize internal reporting as a commercial SaaS offering or a differentiating client portal, which means owning it outright.
- Compliance rules out shared SaaS. Security, data residency, or regulatory requirements can’t be fully met on a multi-tenant platform.
Three situations show up again and again:
- A brokerage or marketplace wants one place that unifies MLS, CRM, and marketing data so agents and leadership stop arguing over which dashboard is right.
- An investment manager wants portfolio analytics and AVM models feeding buy/hold/sell decisions, with numbers current enough to act on before the market moves.
- A property management group wants NOI, occupancy, and maintenance trends across the whole portfolio and is trying to decide whether that needs a new platform or just better reporting on the PMS it already has.
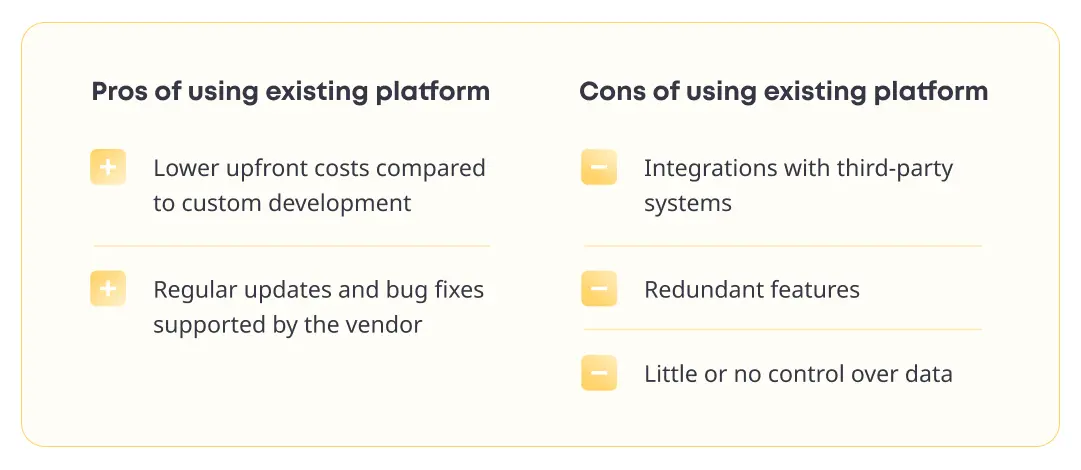
Advantages of Building From Scratch
When a ground-up build is the right call, the advantages are real and durable. Each one, though, is a consequence you’re choosing to own:
- Full control over the data model and analytics logic. You model your workflows (lease rollups, deal pipelines, geospatial views) and define how properties, leases, investors, and deals relate, without bending them to a tool’s assumptions. Consequence: faster analyst workflows and fewer manual workarounds.
- Full data ownership. Your data lives in your warehouse, under your governance and security rules. Consequence: no per-seat ceiling, no vendor sitting between you and your own numbers.
- Deep, purpose-built integrations. You can build the MLS integration or PMS sync the way your business actually works, not the way a connector happens to. Consequence: cleaner data and fewer reconciliation headaches downstream.
- AI-ready architecture. You design schemas, features, and permissions to support future AI use cases instead of retrofitting them later. Consequence: AI becomes an extension of the platform, not a bolt-on that fights the data model.
- Tailored user experience and workflows. You build the dashboards, filters, and alerts that match how your teams actually make decisions. Consequence: higher adoption, because people aren’t forced into a generic UI that hides the view they need.
- Scalability on your terms. You design for the data volume and concurrency you expect in three years. Consequence: the platform grows with the portfolio instead of hitting a wall.
- A monetizable asset. A platform you own can become a product you sell. Consequence: analytics shifts from a cost center to a potential revenue line.
That last point matters most when a specific module carries the business: valuation, for instance. How to Build an AVM Listing Platform for Real Estate Brokerages walks through how a pricing engine fits inside a broader analytics stack rather than living as a bolt-on.
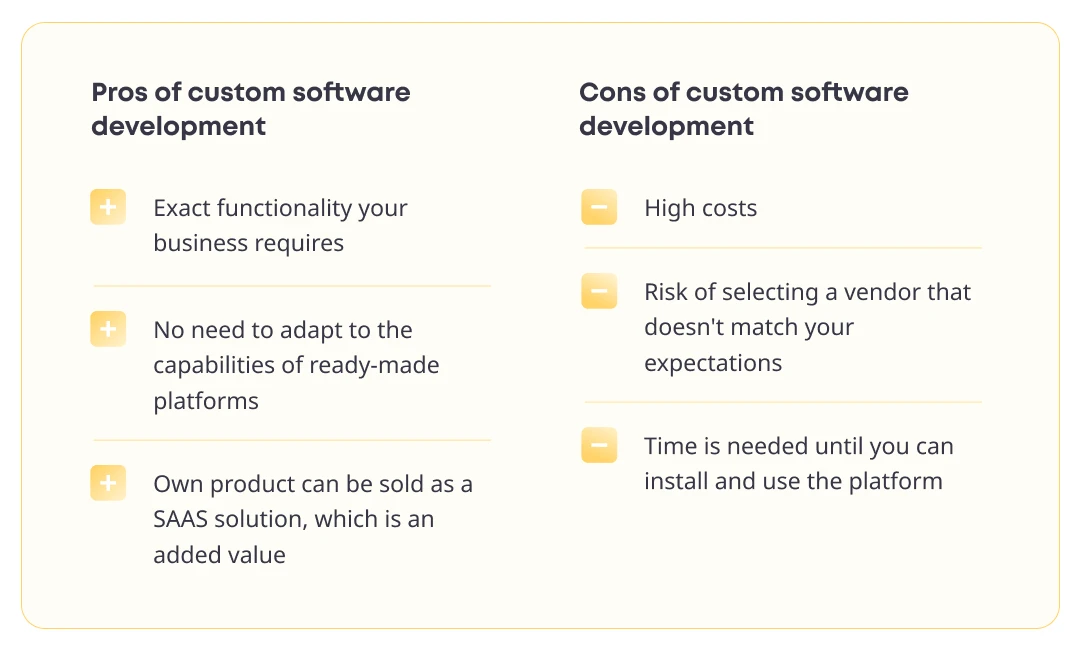
Challenges, Risks, and Cost Drivers
The honest counterweight: ground-up development is a serious, ongoing commitment, and most teams underestimate it in predictable ways.
Challenges and risks
- The integration and data-quality iceberg. We often see teams budget for dashboards and forget that most of the effort is upstream: cleaning, matching, and de-duplicating data across sources that never agreed on a format.
- A product, not a project. Analytics is never “done.” Sources change, MLS rules shift by region, and users want new views. Someone has to own it after launch.
- Adoption risk. You can ship a technically sound platform that teams quietly route around because it doesn’t match how they actually work. Features nobody uses are pure cost.
- Vendor and team selection risk. Pick a partner who treats a PMS integration as a four-week ticket rather than a long-term data relationship, and you pay for the rework later.
- Higher total cost of ownership. The build estimate is the visible cost. Maintenance, infrastructure, and specialist retention are the larger, recurring ones.
Key cost drivers
- Scope. The number of modules, dashboards, and distinct user roles you support drives cost more than any single feature.
- Number and messiness of data sources. Each MLS region, provider, and internal system adds mapping and maintenance work.
- Data quality and cleansing are usually the single most underestimated line.
- Supported platforms. Web-only is cheaper than web plus native mobile, which adds a second build-and-test surface.
- UX and visualization complexity. Custom geospatial views, interactive drill-downs, and heavy dashboards cost more than standard charts.
- Infrastructure. Warehouse, pipelines, and compute scale with data volume and refresh frequency.
- AI and advanced features. Valuation models, anomaly detection, and natural language queries add capability and cost.
- Ongoing maintenance. Plan for it as a permanent share of engineering capacity, not a one-off.
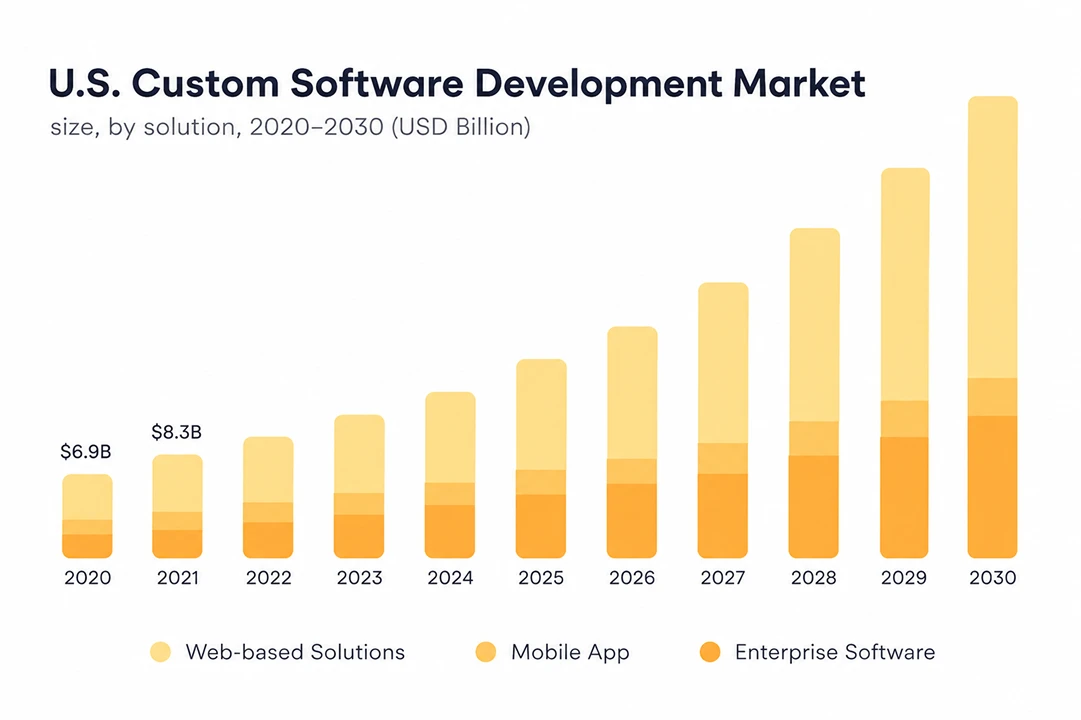
When Building From the Ground Up Makes Sense (And When It Doesn’t)
Use the pressures and costs above as your test. The build is justified when enough of the following are true at once.
It makes sense when
- Analytics is core to how you compete. It’s the product, or the thing customers pay you for, not a supporting report.
- No existing tool fits, because your data model, security, or workflow is genuinely unusual.
- You already have (or will fund) a team that can own it long-term.
- Your data has enough scale and value that better decisions clearly move revenue, retention, or risk.
- You have regulatory or reporting requirements (including ESG and impact reporting) that push you toward centralizing data anyway. Sustainable Urban Development with SaaS covers that driver.
It probably doesn’t when
- Analytics is a feature, not the core value (like the property management group that mainly needs cleaner reporting on its existing PMS).
- Your questions are common ones that an off-the-shelf tool already answers well.
- You can’t staff ownership past launch. An unmaintained platform decays fast.
- Speed to a first answer matters more right now than a perfect fit.
A concrete contrast: a large investment manager running several funds, each with its own reporting logic and AVM inputs, has the complexity and the budget to justify a custom real estate analytics platform. A small brokerage that mainly needs a handful of KPIs and a clean weekly report almost never does. A configured BI tool will serve it better, sooner, and for far less.
If you’re weighing this for your portfolio, brokerage, or PropTech product, our custom real estate software development expertise outlines the kinds of platforms we’ve already delivered in this space.
Data Architecture and Integrations You Need to Get Right
If you do build, this is where the platform is won or lost. It helps to think of the architecture as layers:
- Data sources: MLS feeds, property and market data providers, CRM, PMS, ERP, accounting, IoT sensors, and marketing platforms.
- Ingestion and pipelines: ETL/ELT jobs with scheduling and error handling you can monitor.
- Storage: a data warehouse or data lake with clear schemas.
- Semantic layer: where entities and metrics (properties, units, leases, investors, deals; “vacancy rate,” “cap rate”) are defined once and used everywhere.
- Analytics and BI: query engines and transformation logic on top.
- Dashboards and applications: role-based views for asset managers, brokers, executives, and investors.
The important requirements are less visible than the layers:
- Data quality and normalization so sources agree on format
- Deduplication and identity resolution so the same property or tenant isn’t counted twice
- Robust permissions and auditing, since you’re handling sensitive financial data.
Building from the ground up means you own and design every one of these decisions.
Integrations are the hard part in real estate, specifically. Many MLS integrations aren’t standard REST integrations.
Feeds vary by region, carry their own schema and access terms, and need custom mapping before the data is usable. How MLS Works and Why It’s Key to Real Estate goes deeper, and Benchmarking Top Real Estate APIs can help you pick providers that fit a long-term strategy rather than a quick demo. Our analytics and data platforms expertise shows how we design these foundations.
A related consideration for brokerages is how to separate day-to-day CRM workflows from the infrastructure used for reporting and analytics. The case for a dedicated data platform alongside the CRM explains how a shared data layer can support these needs without requiring brokerages to replace their existing CRM.
Making Your Real Estate Analytics Platform AI-Ready
AI is only as good as the data feeding it. Treat AI-readiness as an architecture decision, not a feature you add later. A clean semantic layer and well-modeled warehouse make LLM-ready data possible. Without them, natural language queries return confident nonsense.
Concretely, “AI-ready” means:
- A clean, well-documented data model; consistent semantics for properties, leases, tenants, and deals.
- Event data that captures user behavior and asset lifecycle, not just the current state.
- Permission-aware context, so an AI assistant can’t surface numbers that a given user shouldn’t see.
The useful framing is always workflow first, then the buy/integrate/fine-tune/build decision:
- Natural language queries over your own metrics (for example, “which properties in this market have the highest churn risk in the next six months?”), usually an off-the-shelf model integrated against a well-defined semantic layer.
- Anomaly detection on occupancy, pricing, or spend flagging the outliers a human would otherwise miss.
- Pricing and valuation recommendations based on comparable properties and market trends.
- AVM models for valuation, the classic buy-vs-fine-tune-vs-build call, are driven by how specific your market and data are.
- Portfolio risk scores and what-if scenarios that let a team model a rate change or a market shift before it happens.
- Automated narratives that summarize portfolio performance for investors, drafted from the same trusted numbers.
The connection to ground-up development is direct: building from scratch lets you design this data model and event tracking from the start, instead of patching AI onto messy data later.
Valuation is where AI-readiness gets tested hardest, because a wrong number has a dollar cost. How to Get an Accurate Property Valuation in PropTech covers the data and logic behind valuations you can actually trust.

Timeline and Team
Timelines vary with scope, but the shape is consistent. A useful mental model:
1.Discovery and solution design (2–3 weeks). Clarify use cases, data sources, success metrics, and high-level architecture, and audit data quality before writing platform code. Skipping this is the most common cause of overruns.
2.Typical MVP build (2–5 months). Implement the initial data pipelines, core dashboards, and key workflows, and integrate with the critical systems first.
3.Testing, stabilization, and pilot rollout (3–6 weeks). Run UAT, fix issues, onboard the first users, and collect feedback before widening access.
Realistically, expect months, not weeks, before a ground-up platform is dependable, and plan for ongoing work after that. Timelines shorten when your data is already clean and well-governed, and stretch when integrations or requirements are complex.
On the team side, a credible build needs a product owner from the business side, a solution architect, a data engineer (pipelines and warehouse), a backend engineer (integrations and APIs), a frontend engineer (dashboards and UX), QA, and DevOps for infrastructure and deployment. Add an ML engineer or data scientist once AI features move from idea to build. The domain knowledge is the part that teams most often underweight. An engineer who has never seen an MLS feed might rediscover its quirks the expensive way.
Alternatives to Full Ground-Up Development
Ground-up isn’t the only way to improve analytics. Several lighter paths often deliver most of the value sooner:
- BI on top of existing data. Point a BI tool at your PMS or warehouse. Best when your questions are fairly standard.
- Embedded analytics. License an analytics engine and embed it in your product. You skip building a visualization layer but inherit the tool’s data assumptions.
- Start with one focused component. Build the single piece that hurts most (one pipeline, one model) before committing to a full platform. You can also pair external data partnerships with a light custom layer that only handles your specific workflows.
That last option is underrated. Our success story, the Rentometer Batch Processor Application, shows how a focused analytics component delivered value while a broader platform vision was still taking shape.
So how do you choose between a full build and one of these lighter paths? It comes down to a few factors, summarized below:
| Factor | Ground-up build | Lighter approach (BI/embedded/phased) |
| Time to first value | 2–5 months to an initial MVP | Weeks to a first working dashboard |
| Upfront cost | High; multiple specialist roles from day one | Lower; license or per-seat cost, small team |
| Data control | You own the model, storage, and pipeline end-to-end | Data often shaped by the tool’s assumptions |
| Customization | Anything your workflow needs | Bounded by what the tool exposes |
| Integration depth | Deep, purpose-built MLS/PMS/CRM integrations | Connectors that exist, or none |
| Maintenance | Yours, permanently | Largely, the vendor’s |
| Best fit | Analytics is core to how you compete | Analytics is a supporting capability |
Examples of Real Estate Analytics Platforms
Before you commit to building from the ground up, it’s useful to understand what existing platforms offer out of the box.
Cherre
Data integration and portfolio analytics. Cherre focuses on connecting fragmented property and market data into a single source that real estate teams can use to make decisions.
TopHap
Location intelligence and market analytics. TopHap layers geospatial and market data into visual analytics for agents, investors, and buyers.
Near
Mobility and location insights. Near uses location and behavioral data to help real estate players understand foot traffic and reach the right audience.
RealNex
Commercial real estate CRM and analytics. RealNex bundles CRM, analytics, and deal tools into one system covering the commercial deal cycle.
If your needs are very close to these use cases, you may not need to build your own platform. One of these will likely get you there faster and cheaper. If your requirements are much more specialized, ground-up development may still be worth considering.
How ORIL Builds Real Estate Analytics Platforms
Our experience spans brokerage platforms, property data products, AVM solutions, analytics systems, and large-scale MLS integrations. We build real estate analytics platforms the way this article argues you should think about them: data foundation first, dashboards second. That means treating the analytics layer as the point rather than an afterthought: centralizing property, deal, and client data so every view draws on the same source instead of a separate export.
From there, the work is turning that data into decisions for the people who need them. In practice, that means:
- Dashboards tailored to brokers, owners, and asset managers, rather than one generic report
- Tracking offers, pipeline, and conversion metrics so nothing stalls unseen; generating reports shaped for different stakeholders
- Integrating with CRM and marketing tools to close the loop from first lead to signed deal.
The result is deal analytics and portfolio analytics that sit on top of clean and connected data.
Across brokerage, property data, and analytics products, we’ve repeatedly seen that the hardest part isn’t dashboard development; it’s designing a data foundation that remains reliable as integrations, AI capabilities, and reporting requirements evolve.
That’s where the harder parts of custom real estate analytics live: supporting complex integrations across MLS, property data providers, and internal systems, and designing data architectures that are AI-ready from the start rather than retrofitted later.
Getting the foundation right is what makes everything above it (dashboards, forecasts, valuation, natural language queries) trustworthy.
Frequently Asked Questions
When does it make sense to build a real estate analytics platform from the ground up?
Building from the ground up makes sense when several conditions hold at once: analytics is core to how you compete, your data model is genuinely complex, no off-the-shelf tool fits, and you can own the platform after launch. If only one of these is true, a lighter approach usually gets you there faster and cheaper.
How much does it cost to develop a real estate analytics platform?
There’s no single price. Cost scales with the number and messiness of your data sources, integration complexity, AI features, and how long you maintain it. Data cleaning and integration are usually the most underestimated line items. The more important figure is the total cost of ownership: maintenance and infrastructure are recurring, not one-off.
How long does it take to build one from scratch?
With modern AI-assisted development, an MVP can often be delivered in 2–4 months, depending on the complexity of integrations and data sources. Building a scalable, enterprise-ready analytics platform remains an iterative effort that continues beyond the initial release. Time typically breaks into a short discovery and data audit, a longer foundational build (pipelines, warehouse, core integrations), then usable dashboards and iteration. The biggest schedule risk is underestimating the data and integration work upfront.
What data sources should a real estate analytics platform support from day one?
Start with the sources your key decisions actually depend on. Usually, that’s MLS feeds, external property and market data, your CRM, and your PMS or ERP. Add IoT or accounting data only where a real decision needs it. Supporting fewer sources well beats connecting many badly, since each one adds mapping and maintenance work.
What team do I need to develop and maintain such a platform?
At minimum: a data engineer for pipelines and the warehouse, a backend engineer for integrations and APIs, a frontend engineer for dashboards, a product owner who understands the real estate domain, and QA. The domain knowledge is the part that teams most often underweight. Just as important is planning who owns the platform after launch, not only who builds it.
Can we start smaller instead of building the whole platform at once?
Usually, yes, and often you should. Building the single component that hurts most, like one clean data pipeline or one valuation model, delivers value sooner and de-risks the larger decision. It also tells you whether a full ground-up platform is genuinely worth it before you commit the full budget.
Conclusion: How to Decide if Ground-up Development Is Right for You
Building a real estate analytics platform from the ground up gives you control, an exact fit to your workflows, and a data architecture you can make AI-ready from the start. It also costs more than most estimates suggest. In time, in money, and in the ongoing complexity of owning a platform rather than renting one. The decision comes down to whether that trade is worth it for where your business actually is.
A quick way to check:
Ground-up development is likely right for you if:
- Analytics is core to how you compete.
- Your data model spans multiple markets or asset classes, and no off-the-shelf tool fits it.
- You need deep integrations across MLS, property data, CRM, PMS, and internal systems.
- You can fund and staff the platform after launch, not just through the build.
It’s probably overkill if:
- Your questions are fairly standard, and a BI tool or existing platform already answers them.
- You mainly need cleaner reporting on data you already hold in a PMS or CRM.
- You can’t commit an owner to maintain it once it’s live.
If you’re somewhere in the middle, the useful next step is to look at your data honestly before committing to a build. If you’d like to stress-test that decision with a team that has delivered real estate analytics and data platforms, you can reach out through our analytics and data platforms and real estate expertise pages. We can help you assess your data maturity, weigh architecture options, and sketch a realistic roadmap.
For deeper reads on specific parts of the decision: a build vs buy guide for real estate analytics platforms on the core trade-off, a data-native real estate platform guide on architecting around one shared foundation, and a roadmap from MVP to data-driven platform on when to invest in data, architecture, and UX. More examples live in our Technology Insights section.


