Multifamily Data & AI Enablement Case Study | ORIL

Client

US multifamily operator, $2B portfolio

Industry

Multifamily, PropTech

Services

Data Enablement, including data integration, data enrichment, data visualization, and an AI assistant

Key results

15+ systems unified · 100+ GB of data structured · +1.2% occupancy in 12 months

Key Business Challenge: A Portfolio Run on Disconnected Systems

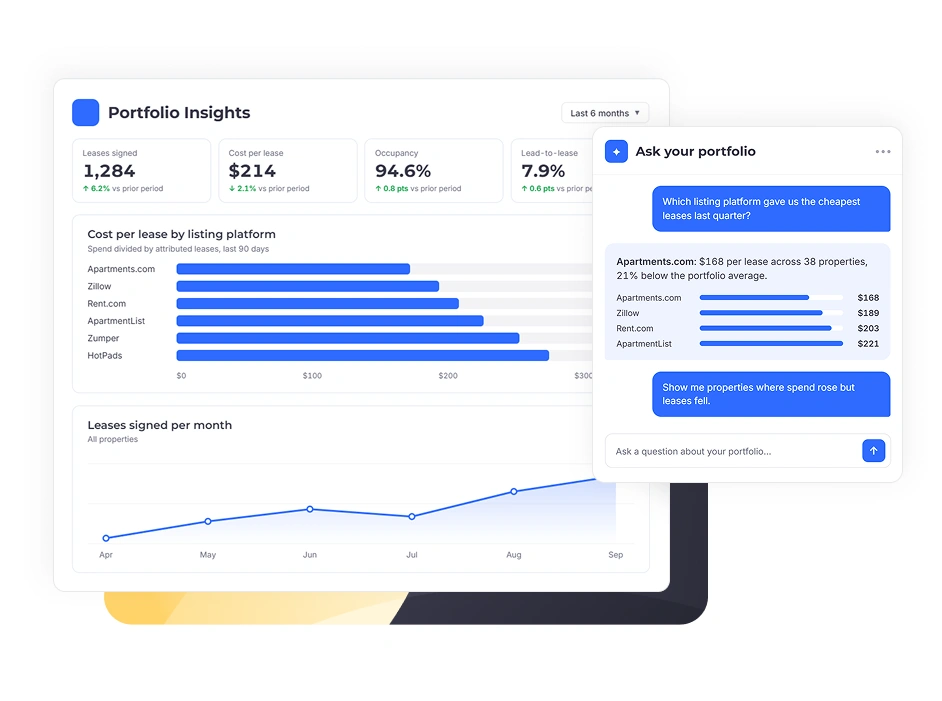
With 5 PMSs, 10+ listing platforms, and separate marketing and finance data, no property had one agreed record. Even a simple question, like which listing platform brings the cheapest leases, meant matching data by hand across several systems.

What it meant for the business:

  • Portfolio insights required combining data from multiple systems.
  • Teams worked from inconsistent numbers, which limited leadership visibility.
  • Analysts spent their time reconciling data instead of analyzing it.
  • Budget and resource decisions lacked a shared data foundation.

The same scattered data blocked other questions too:

  • Which properties are increasing marketing spend while signing fewer leases?
  • How do occupancy and leasing trends compare across the portfolio?
  • Where should next quarter’s marketing budget go?
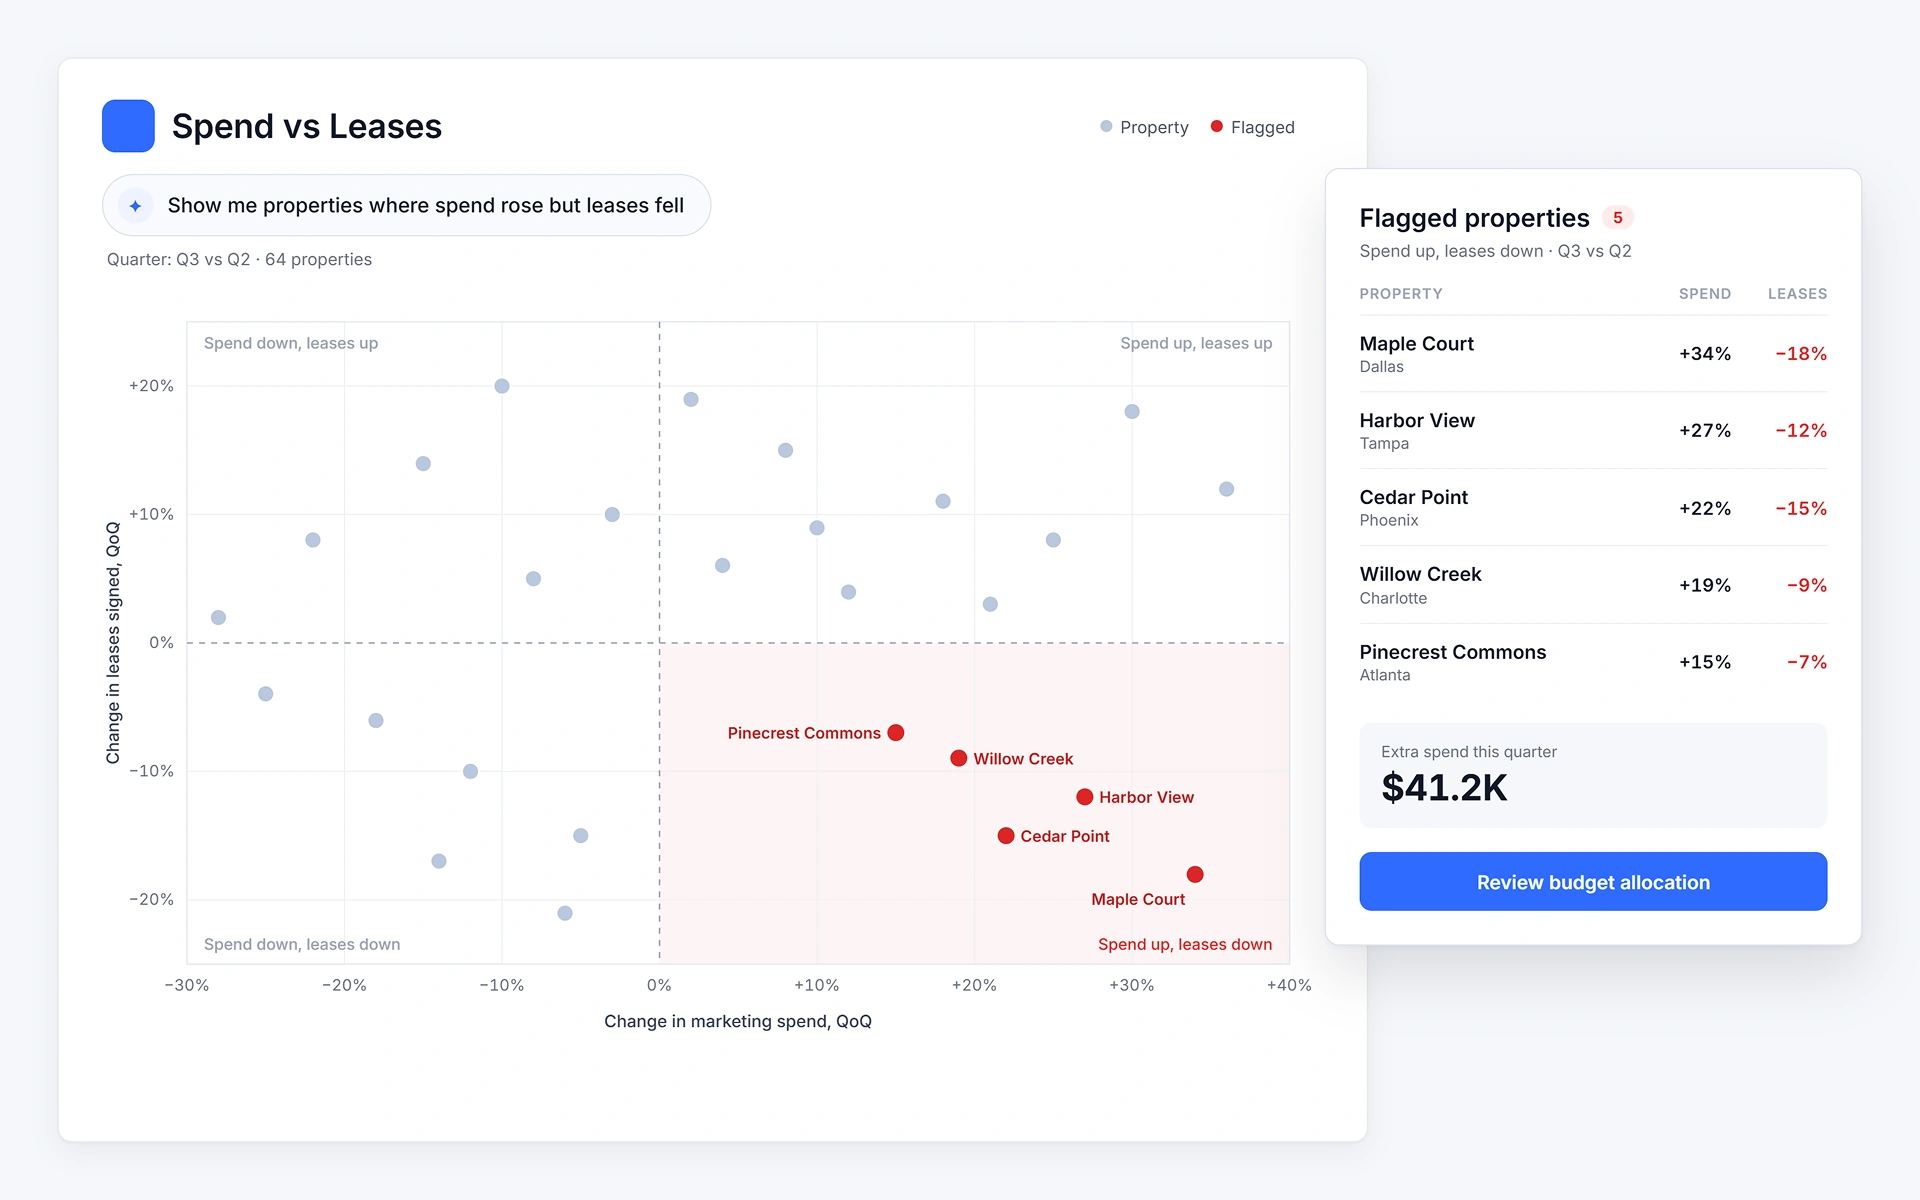
Scatter plot comparing marketing spend versus lease changes across 64 properties, highlighting 5 flagged properties with spend increases but lease decreases

Project Roadmap

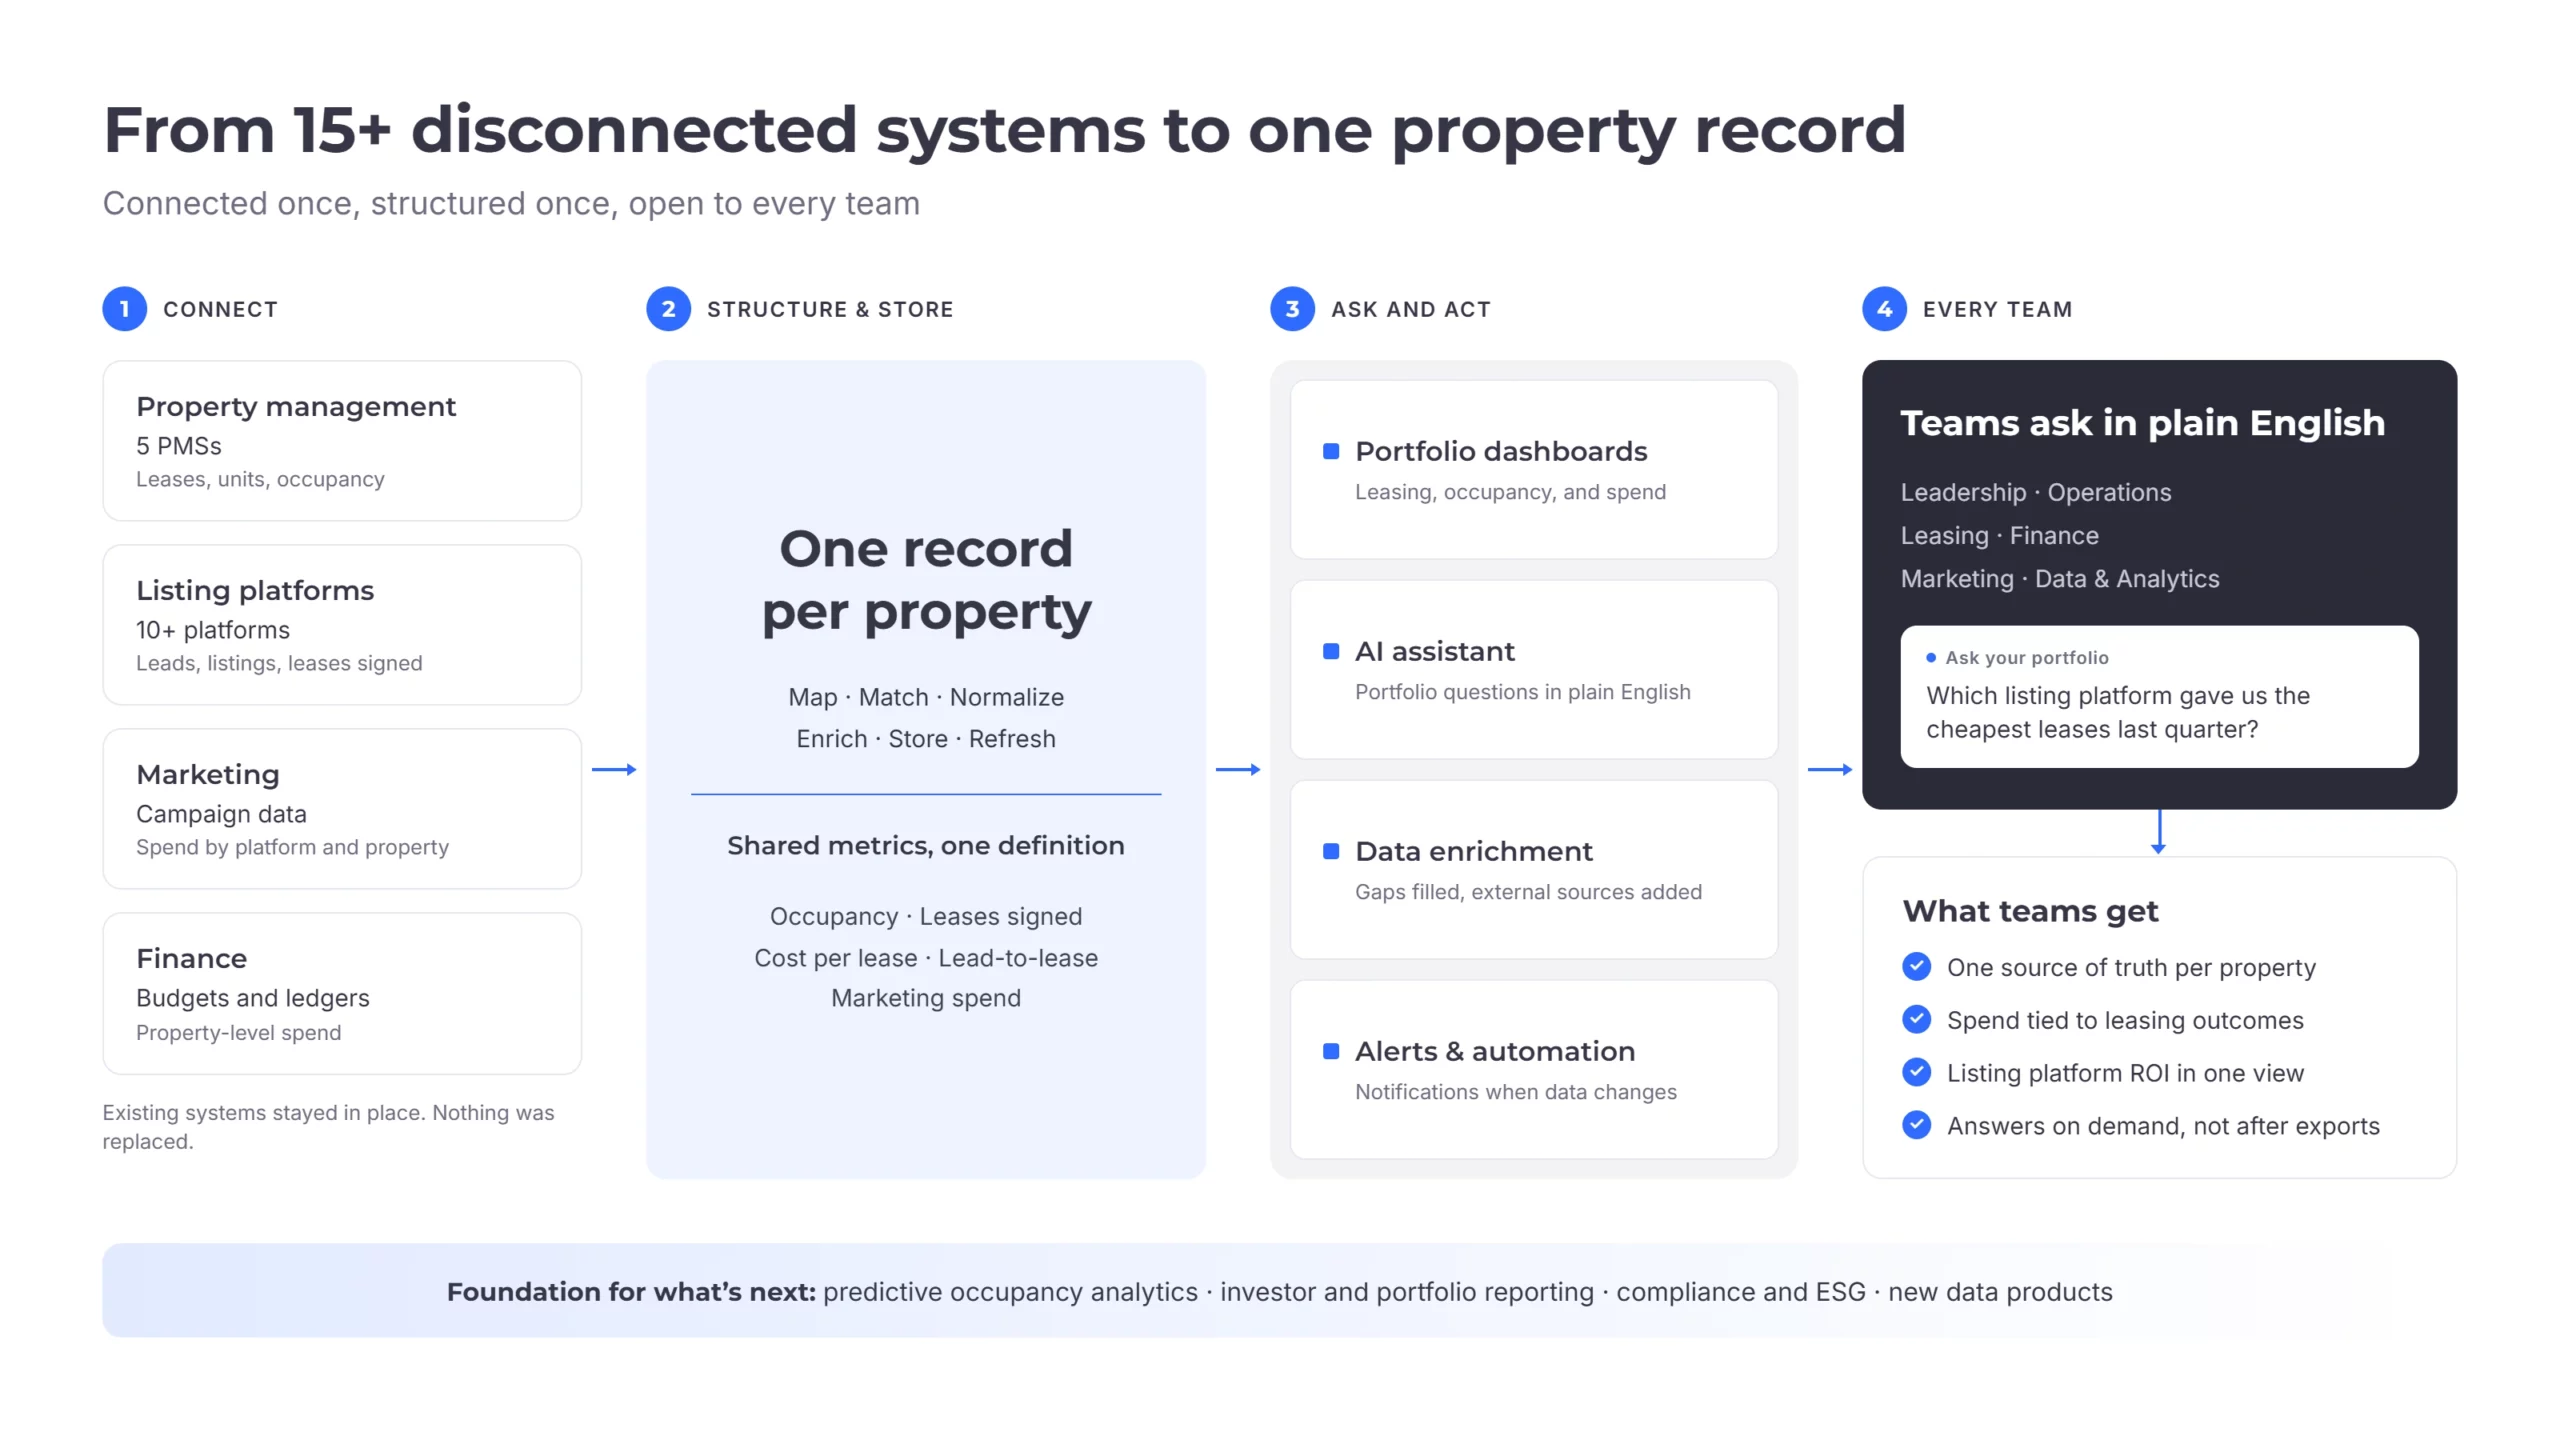
ORIL built a connected data layer across the systems the operator already used. Every PMS, listing platform, and finance source stayed in place; ORIL connected them, structured the data into one shared property record, and gave every team dashboards and an AI assistant built on it.

01
02
03
04

01Collection & Storage

connected 15+ sources, including 5 PMSs, 10+ listing platforms, and marketing and finance data, and mapped them into one record per property with automated refresh. Learn more: Real Estate Data Integration. Outcome: a reliable single source of truth.

02Data Enrichment

filled data gaps and brought in external sources for additional insight. Learn more: Real Estate Data Enrichment. Outcome: a fuller picture of every asset.

03Deliver Intelligence

portfolio dashboards for leasing, occupancy, cost per lease, and spend, plus an AI assistant that answers questions in plain English, such as “Which listing platform gave us the cheapest leases last quarter?” Learn more: Real Estate Data Visualization. Outcome: everyday decisions made from shared numbers.

04Process Automation

workflow automation with event-triggered alerts and notifications. Outcome: less time on manual work.

Property data integration workflow showing 4 steps: connecting systems, creating unified records, analyzing data, and enabling cross-team collaboration

The Engineering Behind Trusted Answers

Most AI tools skip the hardest part: making sure the same property means the same thing in every system. That work is what makes the answers reliable.

01

Source integration: each PMS, listing platform, and finance source connected the way it allows.

02

Schema mapping: different formats and field names mapped to shared definitions.

03

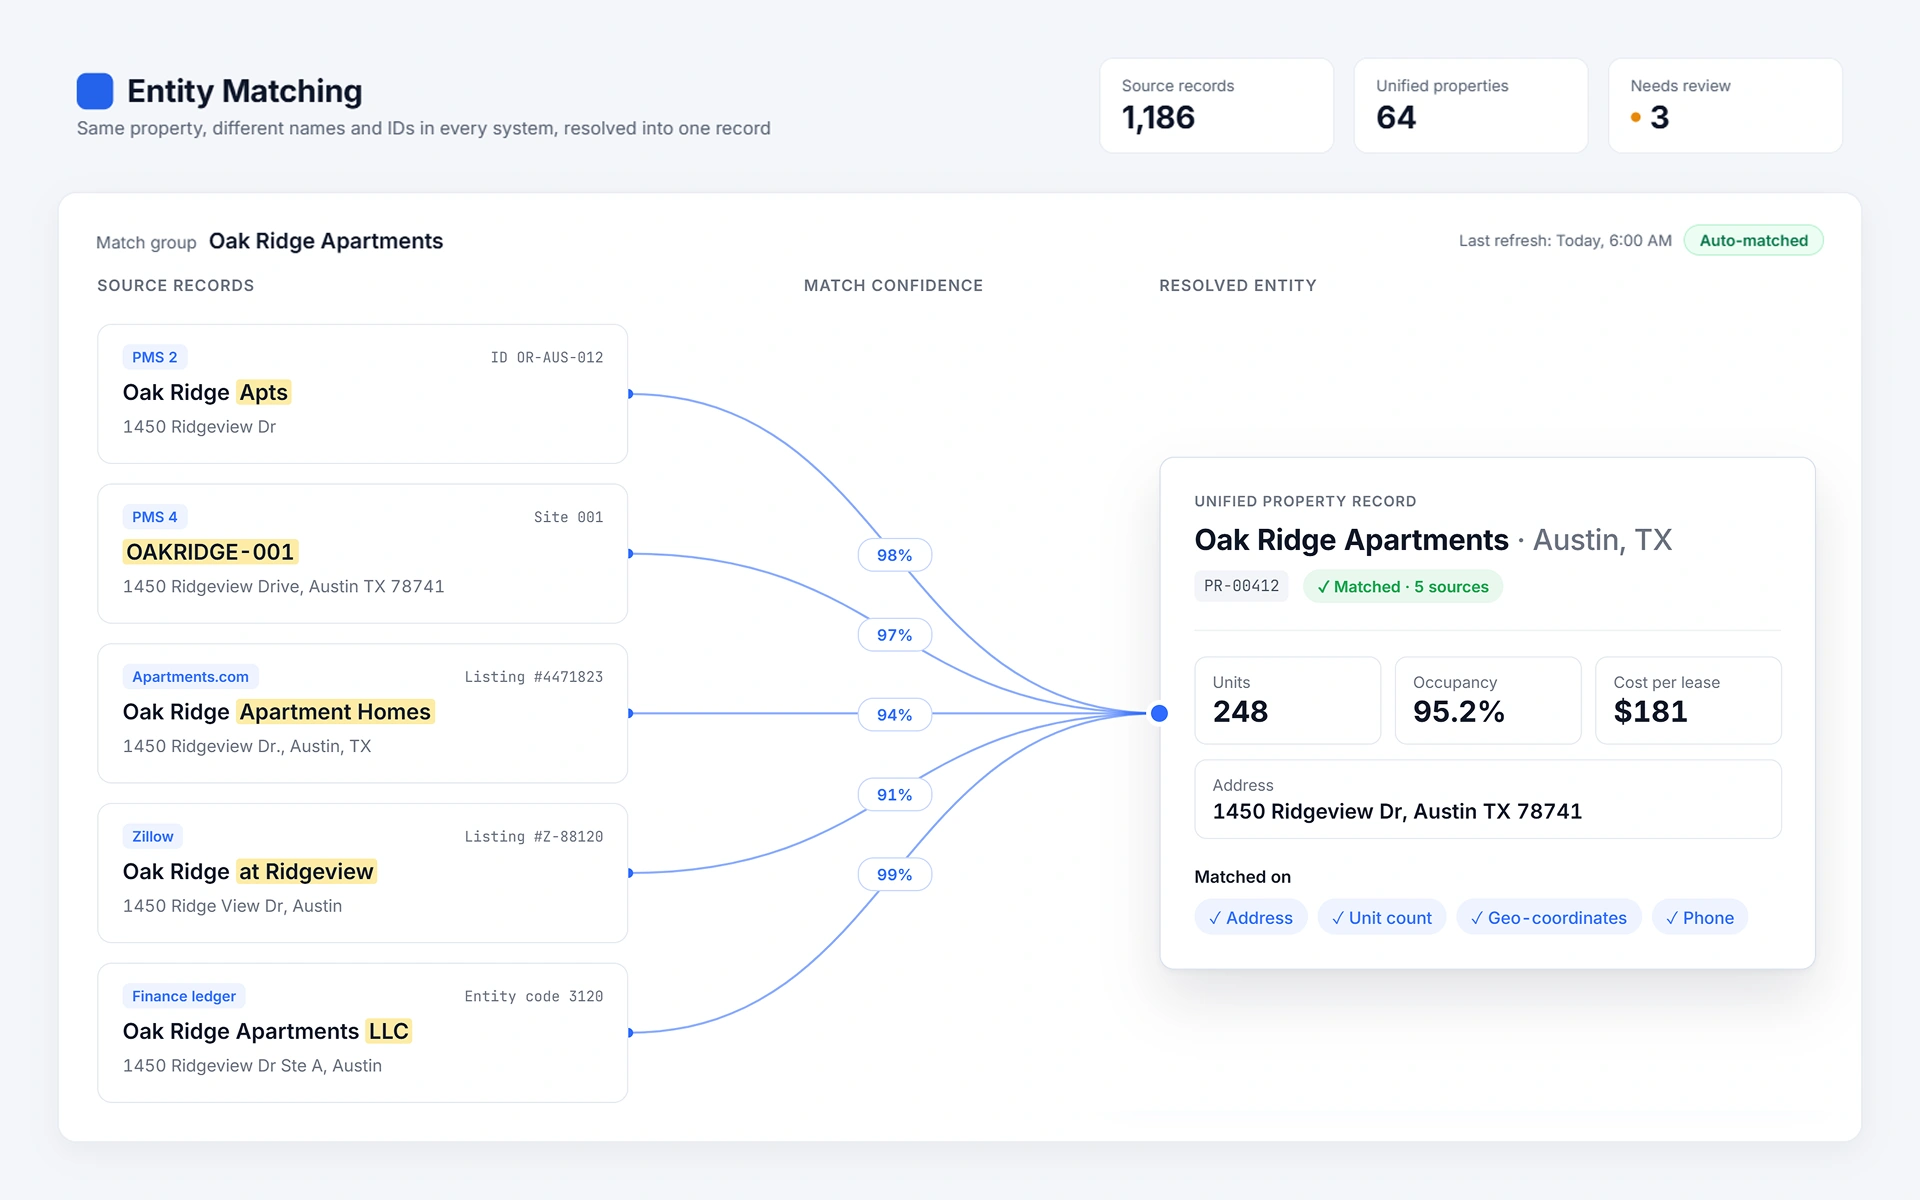
Entity matching: the same property recognized across systems, even when names and IDs differ.

04

Data normalization: records cleaned and standardized so metrics can be compared.

05

Shared metrics: one agreed definition for occupancy, cost per lease, and other KPIs.

06

Automated refresh: data kept up to date without manual exports.

07

Natural-language query layer: plain-English questions translated into queries on the shared data.

Entity matching dashboard showing Oak Ridge Apartments unified from 5 sources with 98% confidence across multiple property databases

Before and After: From Spreadsheet Reconciliation to One Search Bar

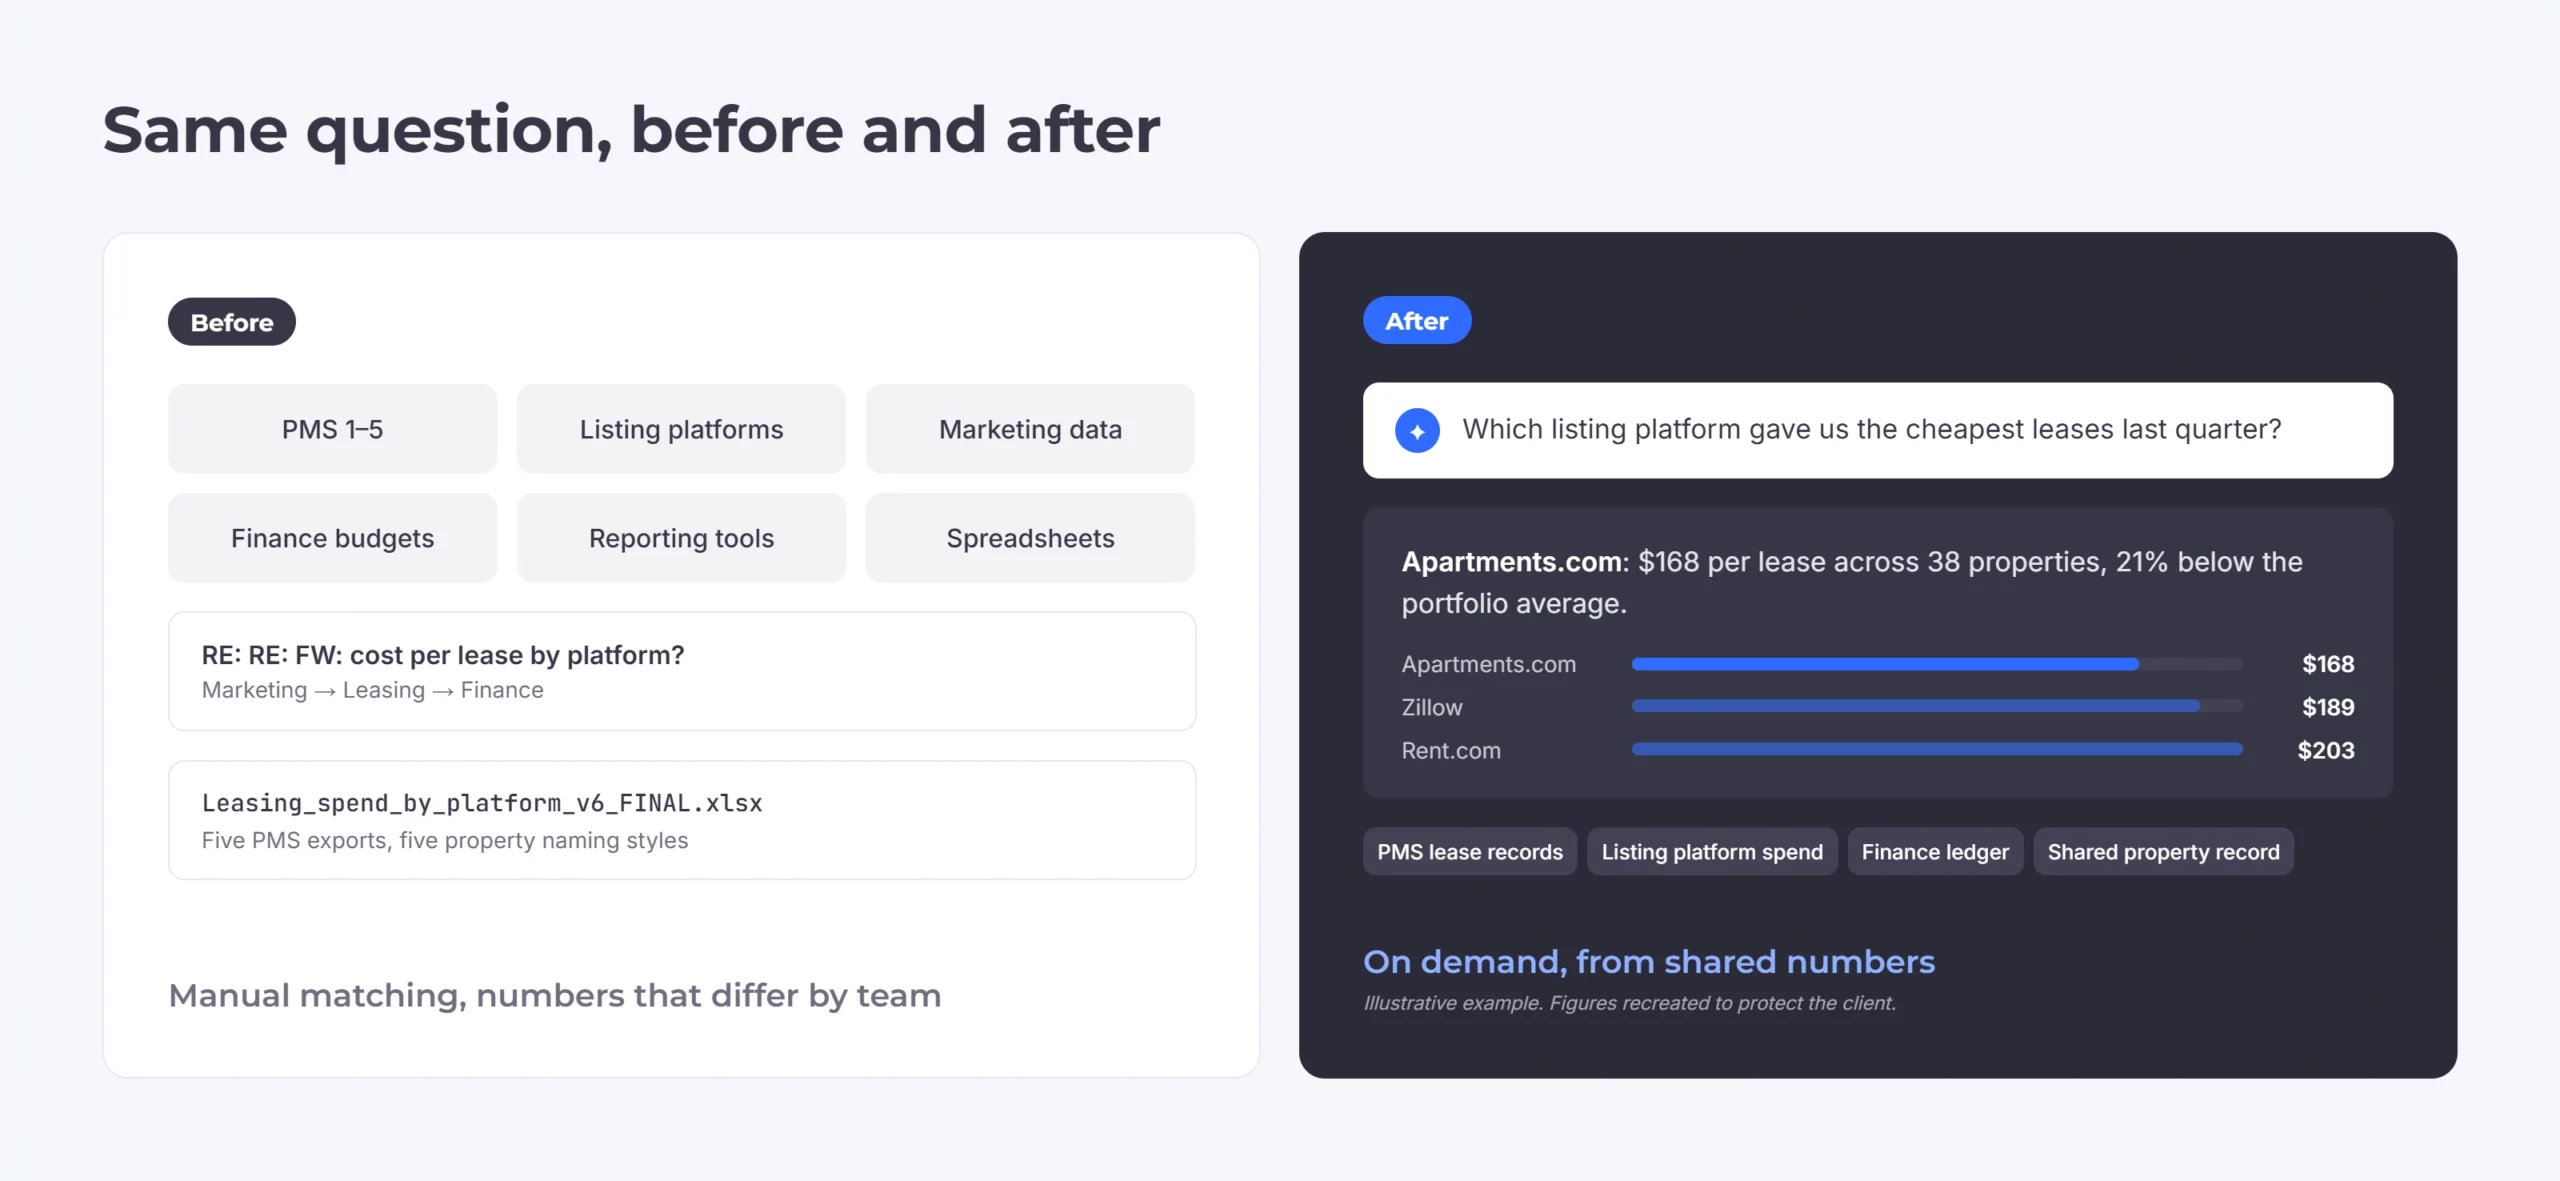
Before: the cost-per-lease question meant exports from marketing, several PMSs, and finance, then manual matching in spreadsheets.

After: the same question goes into the AI assistant. The answer can include:

  • Cost per lease for each listing platform, ranked
  • A comparison with the portfolio average
  • Follow-up questions in plain English, such as “Show me properties where spend rose but leases fell”
  • Dashboards that track leasing, occupancy, and spend over time

The analyst reviews the answer instead of building it.

Comparison of manual data matching versus automated platform analysis showing lease cost breakdown by listing platform with Apartments.com cheapest at $168

Results

15+

systems unified into one property record

100+

GB of data structured

+1.2%

occupancy in 12 months

90%

less time on research for the Data & Analytics team

Beyond the numbers:

  • One source of truth: every team works from the same property record and the same metrics.
  • Smarter marketing spend: budget decisions are based on measured listing platform performance.
  • Faster answers: portfolio questions are answered on demand, not after a round of exports.
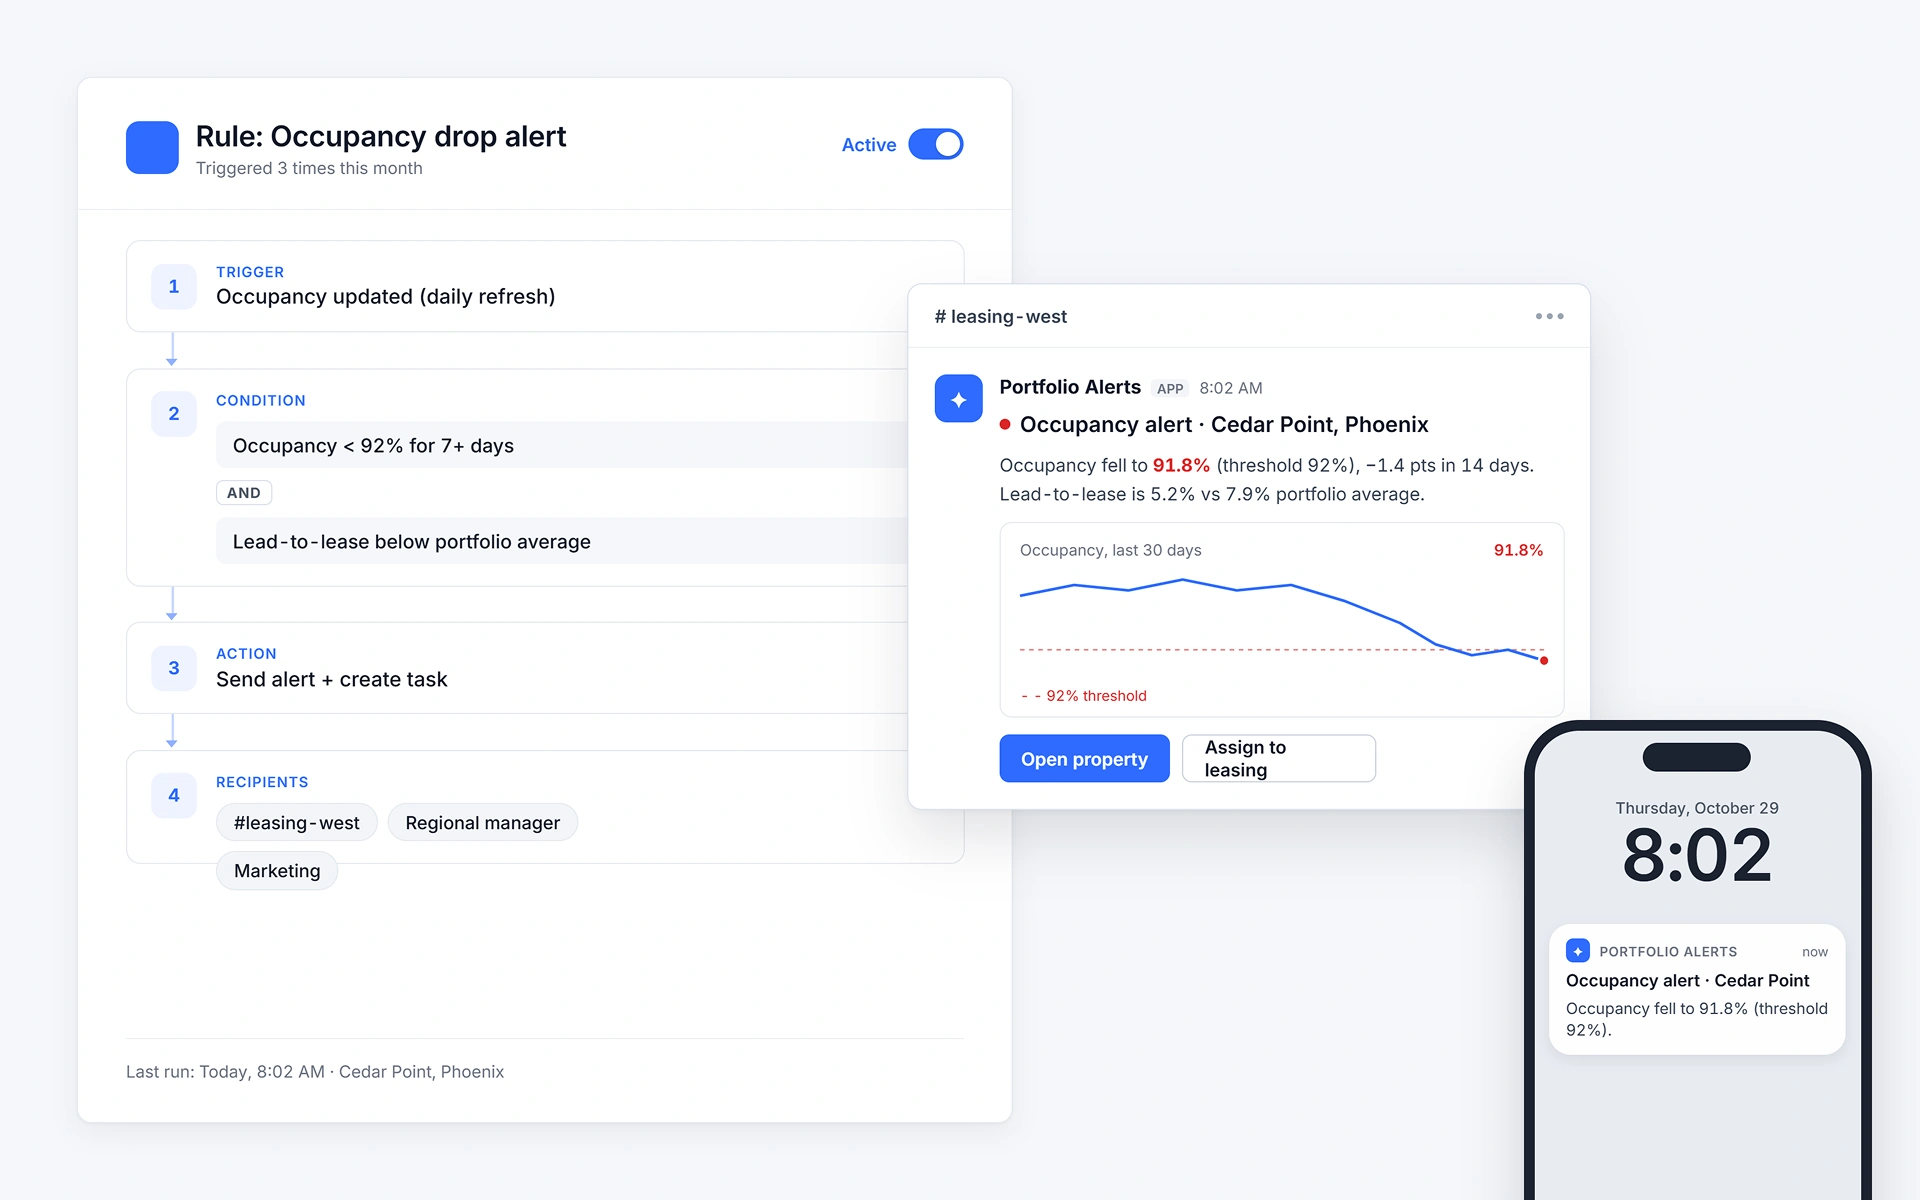
  • Less manual work: automated refresh, alerts, and notifications replace routine follow-up.
  • A foundation for future AI: structured data supports new assistants, analytics, and automation.
Automated occupancy alert workflow showing trigger conditions, notification preview, and mobile push alert for property management system

What This Foundation Unlocks Next

With one structured property record in place, the operator can add new capabilities without rebuilding the data layer:

Automated reporting and alerts

Predictive analytics for occupancy and demand

External data enrichment

Compliance and ESG reporting

Investor and portfolio reporting

Asset valuation and due diligence

New data products

What Would Your Leadership Ask First?

Bring us one question your teams struggle to answer today. We’ll identify the data behind it and outline what it would take to answer it on demand.


    I have read and accepted the Privacy Policy & Cookie Policy