

Which properties in your portfolio are becoming less profitable, and why? A reliable answer usually means pulling lease and occupancy data from the property management system (PMS), operating costs from accounting, maintenance records from a third platform, and rent comparables from outside the company. Some of it lives only in a spreadsheet one analyst maintains. The answer can take days, and two teams can come back with different numbers.
Large real estate companies rarely lack software or data. What they often lack is a consistent way to use information across systems, so every cross-portfolio question turns into a manual reconciliation exercise.
The fix starts with one business question and the data needed to answer it reliably. This is how ORIL approaches data enablement: as part of building software a real estate team can trust with a specific business task, whether that ends up being a report, an automated workflow, or an AI assistant.
Why Real Estate Companies Struggle to Use the Data They Already Have
Property data is created at every stage of an asset’s life, from site sourcing to leasing to finance, and each stage usually has its own software and owner.
A CRM tracks acquisition opportunities. Development tools manage projects. A property management system records leases and occupancy, while accounting software holds financial transactions. Asset registers, maintenance platforms, and spreadsheets add further records. Each tool serves a specific function, but no single system necessarily provides a complete view of the asset.
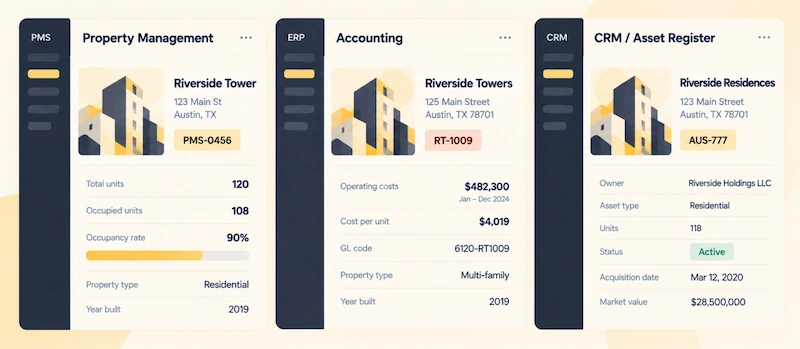
To answer a portfolio question, an analyst may need to compare records from several systems, confirm that they refer to the same asset, and check whether the figures use the same reporting period and definitions.
What Is Data Enablement for Real Estate?
Data enablement for real estate is the ongoing engineering process of connecting data from existing systems, structuring it into a consistent model, and putting it to work through AI, reporting, and automation.
It determines which records need to be connected, how the same property is identified across sources, how metrics such as occupancy or net operating income (NOI) are defined, who can see what, and how the data reaches the tools that use it.
| Term | What it is | How it relates to data enablement |
| AI assistant or chatbot | A product: a conversational interface | One possible consumer of enabled data. Its answers can only be as consistent as the records and definitions behind it. |
| Knowledge base or document search | A product for finding information in files such as leases and policies | Covers unstructured documents. Portfolio calculations also need structured records and shared metric definitions, which data enablement provides. |
| Data platform or data warehouse | Technology for storing and serving data | Often something data enablement builds or extends when a use case needs one. |
| PMS, CRM, and accounting systems | Systems of record for daily operations | Usually stay in place. Data enablement connects them; selective modernization is an option where a system can’t support a required workflow. |
How Data Enablement Works
A data enablement project usually moves through five stages. The first two build the data foundation, and the other three put it to use. Not every project needs all five: scope depends on the use case, the systems involved, and security requirements.
| Stage | What happens | Result |
| 1. Discovery and mapping | Map systems, data owners, data quality, and gaps; prioritize use cases | A data map and an implementation estimate |
| 2. Integration and storage | Connect sources, normalize records into a shared data model, store and refresh the data | One consistent view of each asset, lease, and project |
| 3. Enrichment | Add third-party and public data to internal records | More complete property and ownership profiles |
| 4. Insights: AI and reporting | Dashboards, a natural-language assistant, and predictive analytics on the connected data | KPIs and answers teams can trace to their sources |
| 5. Process automation | Alerts, document extraction, automated reports, and custom applications | Workflows that run on the data with fewer manual handoffs |
1. Discovery and Mapping
List the systems that hold part of the answer to the chosen question.
Beyond the tools named above, that often includes document stores, databases, and selected external data. For each source, note who owns it, how it can be accessed, how often it changes, and where it is known to be wrong. Check the cost of getting data out as well: some PMS vendors charge for data export licenses.
2. Integration and Storage
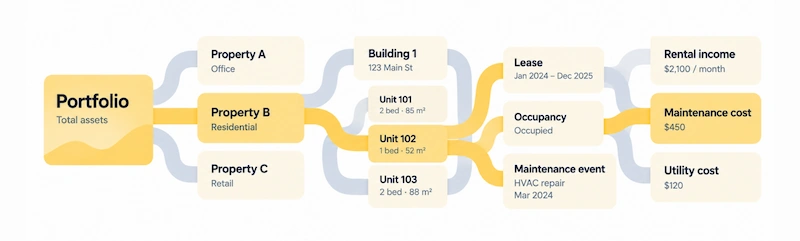
Before any report, dashboard, or AI tool can compare records, the company needs consistent field definitions and a reliable way to identify the same property across sources.
Normalization standardizes formats and units. Entity resolution determines which records refer to the same real-world asset, using identifiers such as parcel numbers, addresses, and unit IDs. Its matching rules are validated against a sample of confirmed matches before the data is used for decisions.
Conflict handling covers the cases where matched sources disagree. If the PMS and the accounting system report different lease end dates for the same unit, the pipeline needs a rule for which source takes priority for that field, a record of both values, and a review queue for conflicts no rule can settle.
Consider this illustrative example:
| Field | Source A | Source B | Normalized representation |
| Building | Block A | Building 1 | Building ID B-104, after confirming both records refer to the same building |
| Unit type | Flat | Apartment | Apartment |
| Area | 850 sq. ft. | 79 m² | 850 sq. ft. (79 m² converted), with both source values retained |
| Occupancy | Let | Occupied | Separate fields: “Leased” and “Physically occupied” |
Anonymized multifamily example: ORIL integrated data from 15+ source systems, including 10+ listing platforms, for a US multifamily analytics platform. The work established a consistent property-level view while preserving relationships between source records.
Where the integrated data lives depends on how fresh it must be and how the resulting capability will use it. Most implementations use a central repository in the company’s own cloud environment (AWS, Azure, or Google Cloud), while some use cases can start with direct access to a few source systems.
3.Build Reliability Into the Data
Figures from connected data support decisions when people can trust them. That trust depends on four pieces of engineering work:
- Agreed KPI definitions. Metrics such as occupancy, NOI, and maintenance cost per unit are defined once, often in a semantic layer, so every report, dashboard, and AI tool calculates them the same way.
- Data lineage. Each figure keeps a traceable link to its source records and the time they were last updated.
- Access rights. Permissions are mapped into the foundation, so an asset manager sees only the properties they’re responsible for, whether in a report or an AI answer.
- Quality checks. Automated tests flag missing fields, unexpected value changes, and failed matches before they reach a report, and define what happens when the data can’t support a reliable answer.
What Data Enablement Makes Possible in Real Estate
The same foundation can support several types of capability. Each one places different demands on the data.
Enrichment
Illustrative example, not market data: a two-bedroom apartment rents for $1,000, while selected nearby comparables average $1,200. The gap is a signal to investigate, not a pricing recommendation. Before drawing conclusions, the team needs to check whether the properties are comparable and account for differences in location, condition, lease terms, included services, and the quality and date of the external data.
The same principle applies to ownership and mortgage details, transaction history, school ratings, zoning, and environmental risk. Providers such as Cotality, BatchData, and RealEstateAPI are chosen by geography, asset type, and use case.
Most of the engineering work sits in the matching: linking each external record to the right internal property and mapping it to the shared data model.
Insights: AI and Reporting
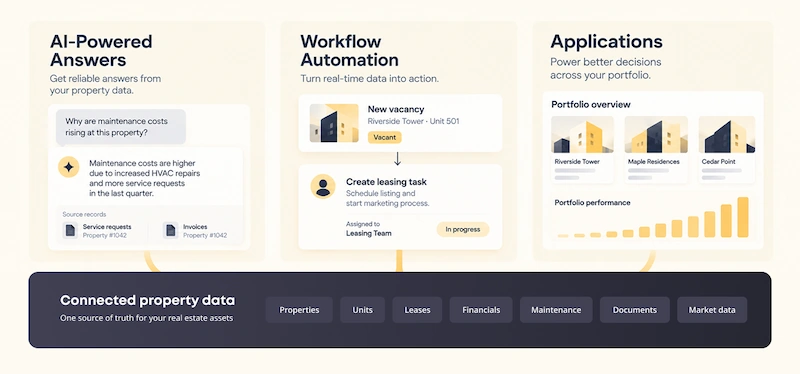
Executives and asset managers can answer ad hoc questions themselves instead of queuing them with an analyst, and forecasts such as next quarter’s maintenance spend per building draw on the same records the dashboards report.
The type of question determines the retrieval method. A question about a lease clause calls for document retrieval. “Which buildings saw the biggest occupancy drop since January?” calls for a structured query that uses the occupancy definition stored in the semantic layer. ORIL’s approach to AI enablement for PropTech covers this layer in more detail.
Process Automation
Structured data can trigger a workflow when a defined condition occurs. For example, a vacancy recorded in the PMS could create a task for the leasing team, notify the responsible property manager, and prompt a listing review. An exception in maintenance costs could be routed for investigation. These triggers need the foundation to pick up changes within the time the workflow allows, through webhooks or frequent syncs where a nightly batch would be too slow.
Each automation needs an owner and clear rules. Not every vacancy deserves the same response.
Custom applications, such as an internal cost-comparison tool or an investor portal, stay aligned with the data when both are built together: the application’s requirements decide which sources to connect and which definitions to follow.
Where to Start: High-Value Real Estate Use Cases
Choose the first use case around a business decision. It should matter to a decision-maker, rely on data that can realistically be connected, and have a result the team can evaluate.
| Business question | Data required | Teams involved | Decision or action |
| Which assets are becoming less profitable? | Revenue, occupancy, operating costs, maintenance costs, agreed profitability definitions | Finance, asset management, property operations | Investigate drivers, prioritize review, or compare operating plans |
| Which operational exceptions need attention? | Vacancies, work orders, service-level targets, cost changes, responsible owners | Property management, leasing, maintenance, finance | Assign follow-up, escalate an issue, or trigger a defined workflow |
| Which acquisition opportunities deserve further review? | Property attributes, financial assumptions, operating history, market comparables, relevant location data | Investment, finance, asset management, development | Compare opportunities and identify gaps for due diligence |
| What is happening across the portfolio this month? | Current portfolio records, KPI definitions, period-specific financial and operating data | Executive leadership, finance, operations | Review performance, ask targeted follow-up questions, and set priorities |
Business Value of Data Enablement
The value shows up in four areas. Measure each against a baseline set before the project starts.
Enterprise Value
Structured, documented data becomes a company asset in its own right. It is easier to evaluate in due diligence and transfer in a transaction, which supports positioning the company as technology-driven in conversations with investors and acquirers.
AI-Enabled Productivity
The first gains usually show up in the reporting cycle: fewer analyst hours per cycle and shorter turnaround on portfolio questions. Operating cost savings come from the specific workflows automation takes over, so measure them per workflow instead of as one project-wide figure.
New Revenue and Products
Connected data can also become a source of revenue through:
- Paid services for residents and tenants
- Investor reporting products
- Licensed data products
- Data partnerships
A company’s own operating history is data competitors don’t have, and custom valuation or cost models built on it can sharpen acquisition and pricing decisions. Viability depends on data rights, privacy requirements, customer demand, and product economics.
Compliance and Sustainability
Energy, emissions, and building data connected to the asset record make ESG and building performance reporting a repeatable process. The same data supports efficiency work that reduces energy use and operating costs.
Linking construction records, such as materials and suppliers, to development and operations data also gives visibility across the full asset lifecycle.
How to Introduce Data Enablement
1. Choose a business problem. Pick one question from your use case shortlist, name the person who will act on the answer, and scope discovery to the sources that question needs.
2. Define the capability needed. This might be an AI assistant, an analytical view, or an automated workflow. Start with the intended business outcome rather than assuming AI is the right solution for every problem.
3. Build, test, and deploy the capability. Test it against real scenarios and agreed success criteria, covering the data, calculations, permissions, and handling of incomplete records as well as the interface. Then deploy it into the systems and workflows people already use.
4. Expand and maintain. If the initial solution proves useful, extend the foundation to other teams or workflows based on demonstrated needs. Keep monitoring it after launch: source systems change schemas, add fields, and retire endpoints, so pipelines, matching rules, and metric definitions need ongoing upkeep.
Build the Data and the Software Together
A data foundation pays off when people use it to make a decision or complete a task. That makes the software around it part of the same project, whether it’s a report, a workflow, or an application.
ORIL approaches data enablement as a software development partner, covering the full cycle: defining the business requirement, connecting and matching source data, setting KPI definitions, access rules, and quality checks, then designing, building, testing, and deploying the application that uses the data.


