

A PropTech platform can receive thousands of sensor readings per minute and still struggle to answer a simple operational question: which buildings ran too warm yesterday afternoon? The readings arrive. Their meaning stays behind in each vendor’s system.
One building reports a point called ZN-T in Fahrenheit through a BACnet gateway. Another sends room_temp_c from a vendor cloud API every 15 minutes. A third exposes a Modbus register that holds a number and nothing else. The first two probably describe the same kind of reading. The third could be a room temperature, a setpoint, or a valve position, and the feed itself won’t say which.
Answering the warm-buildings question means deciding, for every point, what it measures, where it sits in the building, and whether its latest value can be believed. Those decisions end up in code somewhere, and where they live shapes how the product behaves as more buildings come online. At ORIL, we treat that layer as part of the IoT and Smart Building software we build for PropTech companies, designed together with the dashboards and alerts that read from it.
Key Takeaways
- Vendor-specific identifiers and measurement conventions need to be reconciled before portfolio-level reporting is meaningful.
- Normalization makes readings consistent and establishes what each one measures: unit, measurement type, timestamp, and identifier. Contextualization establishes where the sensor sits, which equipment it belongs to, and which other systems it relates to.
- Quality controls should preserve questionable source values and make uncertainty visible.
- Different product features need different data guarantees: an operational alert and a portfolio benchmark have different requirements.
Why Reliable Building Data Matters to PropTech Platforms
Across a portfolio, buildings commissioned by different integrators rarely describe their equipment the same way. Real estate analytics and data platforms built on that telemetry need consistent KPI definitions to compare them, and the gaps usually show up in product behavior first:
| Symptom | Example | Product impact |
| Incomparable measurements | Zone temperature compared with return-air temperature | Comfort rankings point to the wrong buildings |
| Unreliable alerts | A gateway resends its last cached value | Alert fatigue |
| Inconsistent energy reporting | kW demand and cumulative kWh both labeled “energy” | Portfolio comparisons lose credibility |
Where Heterogeneous Building Telemetry Breaks Down
Different vendors can represent equivalent building points and meter data in different ways. These are some of the dimensions that typically diverge (values are illustrative):
| Dimension | Source A | Source B |
| Identifier | BACnet device 2001, object AI-14 | Vendor GUID 7f3a…c9 |
| Point name | B2.F3.AHU3.SAT | “Supply Temp 3” |
| Unit | °F | °C |
| Meter output | Cumulative energy (kWh) | Interval demand (kW) |
| Timestamp | Local time, no offset | UTC |
| Reporting pattern | Polled every 5 minutes | Change-of-value events |
| Metadata | Object name, description, and units property | Modbus register address only |
BACnet can expose structured objects with names, descriptions, and engineering units, though how much of that metadata is filled in depends on how each controller was configured. Modbus integrations may require register documentation and scaling information before incoming values can be interpreted, which is often one of the first tasks in IoT software development for existing buildings.
Vendor cloud APIs vary as well: some return detailed equipment and point metadata, others only values and timestamps, and each brings its own authentication requirements, rate limits, and service availability.
Why Telemetry Normalization Is the Core Engineering Problem
Telemetry normalization is the process of turning vendor-specific readings into one consistent representation inside the platform: shared units, measurement types, timestamp conventions, identifiers, naming, and data structures.
A dashboard or alert rule cannot correct a measurement that has already been assigned the wrong unit or type upstream.
Normalization is more than converting units and fields
Normalization works on two levels:
- Structural normalization handles representation: converting Fahrenheit to Celsius, standardizing timestamps, and mapping vendor field names to platform fields.
- Semantic normalization identifies what a point represents and how it relates to the building system.
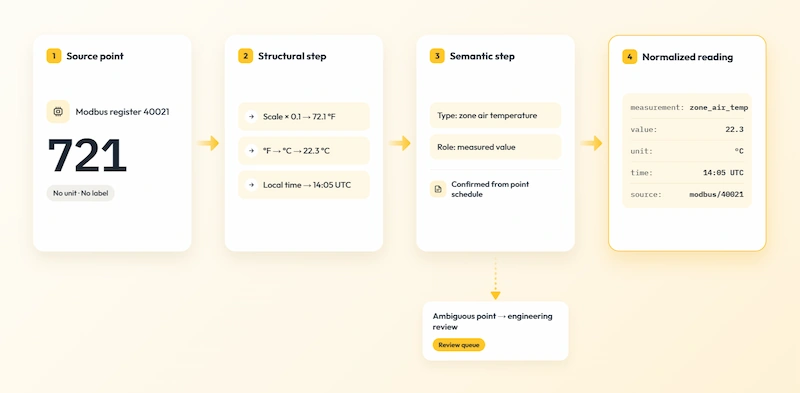
Two details need care in practice:
- Timestamps: where sources lack an offset, the platform needs reliable time-zone metadata and a policy for ambiguous or invalid local times around daylight saving transitions.
- Mappings: a mapping layer can store each point’s target measurement type, unit conversion, source identifier, and applicable validation rules. Keeping mappings and validation rules in version-controlled configuration makes building-specific corrections easier to review and test.
The same measurement can mean different things
Identical labels in a point list often describe different physical realities:
| Label in the source | Possible meanings | What the model has to capture |
| Temperature | Zone, supply-air, return-air, mixed-air, or outside-air temperature | Air stream and parent equipment |
| Setpoint | Cooling, heating, or effective setpoint after an override | Target versus measured value, operating mode |
| Occupancy | Motion (binary), people count, badge data, scheduled mode | Sensing method and coverage |
| Fan | BMS command, or observed operating status from variable frequency drive (VFD) feedback or another status signal | Command versus observed status |
| Energy | Energy consumed in kWh (cumulative register or per interval), or power demand in kW (instantaneous or interval average) | Quantity type (energy versus power), accumulation, and interval |
Several approaches exist for describing equipment, spaces, measurements, and their relationships in a machine-readable way. Brick and Project Haystack are open, community-maintained models.
ASHRAE Standard 223P, which ASHRAE still lists as a proposed standard, approaches the same problem through a standards body. A platform may adopt one of them, map to several, or keep an internal model aligned with them, depending on its customers and source systems.
In an older building, the point list might hold AHU3_SAT, AHU-3 DA-T, and TEMP_17 for related readings, while the controls drawings no longer match what was installed. Name parsing and equipment schedules narrow the options. For points that stay ambiguous, an engineer still has to check trend data or confirm with the site team.
Contextualize Building Telemetry and Resolve Asset Identity
Normalization tells the platform what a reading is. Contextualization tells it where the reading comes from: the space and equipment it describes, and how that equipment connects to the rest of the building. A canonical building model establishes these entity relationships.
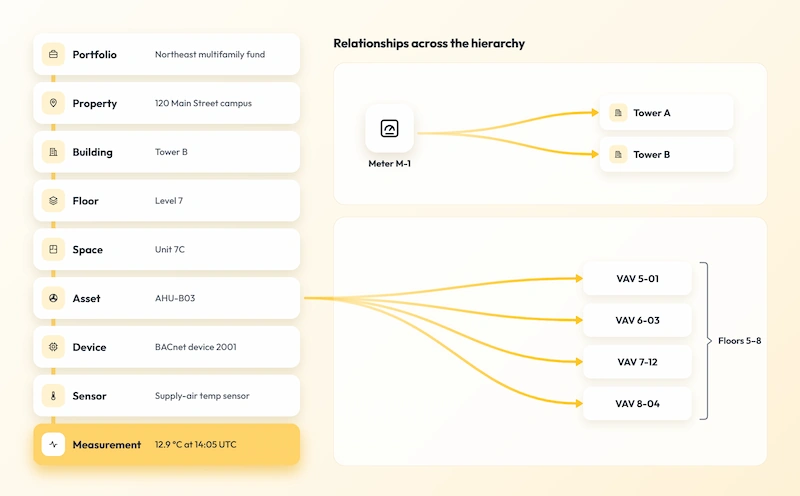
Real buildings also require relationships that cut across this hierarchy. An AHU may serve VAV (variable air volume) boxes on several floors, a space may be served by multiple HVAC systems, and a meter may cover several buildings. The model needs to represent these relationships explicitly instead of forcing them into a simple parent-child structure.
Identity resolution is the next step. Different systems often name the same sensor or asset differently, so the platform maps each source ID to a stable platform ID at the right entity level and keeps every source record traceable:
| Source system | Source ID | Mapped to | Note |
| BMS (BACnet) | Device 2001, object AI-14 | Sensor S-AHU-B03-SAT | Supply-air temperature on AHU-B03 |
| Vendor cloud | GUID 7f3a…c9 | Sensor S-AHU-B03-SAT | Confirmed as the same sensor during commissioning |
| CMMS | Asset tag 00-4471 | Asset AHU-B03 | Maintenance history |
Device replacements also require effective-dated mappings, so an asset’s reading history continues across a swap.
Make Building Telemetry Trustworthy Through Data Quality and Validation
Validation decides whether a reading is fit for a specific use. An LBNL analysis of multi-year FDD fault reports covering more than 60,000 HVAC equipment items found that on any given day, 40% of AHUs and 30% of air terminal units in its dataset had at least one reported fault. These included sensing, mechanical, and control-related issues.
| Issue | Example | Typical check | Typical handling |
| Missing | No readings from Floor 7 since 02:00 | Completeness against expected interval | Mark the gap, distinct from zero |
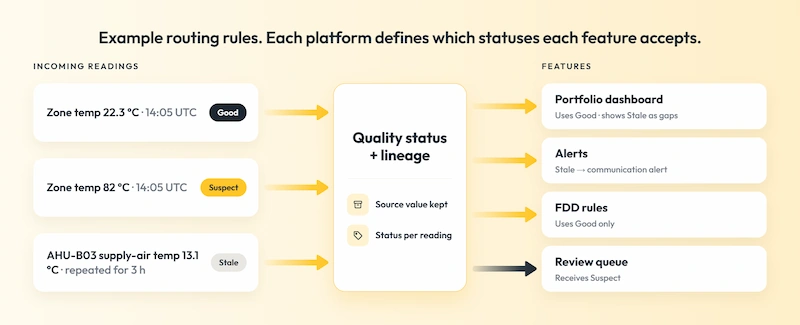
| Stale | Gateway resends a cached value | Freshness and flatline detection | Flag as stale, separate communication loss from equipment faults, apply alert rules that account for missing current data |
| Duplicated | Same reading via BMS and vendor cloud | Match on mapped sensor and time window | Use the preferred source, keep both records |
| Implausible | Zone temperature outside the configured operating range | Measurement-specific limits and operating context | Flag for investigation, keep the source value |
| Inconsistent | Supply-air temperature outside its expected relationship to return-air temperature in a defined cooling mode | Cross-sensor rules per equipment type and mode | Route to diagnostics review |
| Noisy | People count jumping between 0 and 40 | Rate-of-change limits, smoothing | Smooth for display, keep source values |
Platforms can keep questionable readings with a quality status such as good, suspect, stale, or bad, so each feature can decide which statuses it accepts. Where retention policies allow, original readings stay alongside normalized values. When data quality workflows have clear owners, a flagged reading can feed an investigation or maintenance workflow, whether the cause turns out to be the sensor, its mapping, or its communication path.
Sensor noise is only one type of data quality problem
Physical noise is the easiest problem to picture. Unreliable building data can also originate in:
- Sensors: drift, calibration loss, failure, or placement in direct sunlight
- Connectivity: gateway outages, network drops, and buffered data arriving late in bursts
- Timestamps: device clock drift and local times without offsets
- Mappings: a point assigned to the wrong space after a renovation or controller swap
- Source systems: manual BMS overrides, vendor API changes, and firmware updates that alter units or scaling
- Data processing: a unit conversion applied twice, or an average calculated over an incomplete window
The response depends on the source of the error. A clock problem may require timestamp correction, a wrong asset assignment needs a mapping update, and a failed gateway calls for a connectivity investigation.
In machine learning workflows, unidentified sensor drift, missing intervals, and incorrect asset mappings can introduce misleading patterns into training data and model inputs.
Our work on the Parity building data platform provides a practical example. Parity optimizes HVAC systems in apartment buildings using data from diverse HVAC equipment and hardware sensors, which produced inconsistent and unstable inputs. As Parity’s software development partner, we stabilized the platform and added connection-status monitoring to detect incorrect or unstable data, anomaly detection that flags unusual or faulty readings and excludes them from analytics, and baseline-metric logic plus an OpenWeather API integration to support energy-savings reporting.
How Reliable Building Data Supports Operations and Building Intelligence
An engineer watching a chiller restart cares whether the last reading arrived 30 seconds ago. An asset manager comparing comfort across 40 buildings cares whether each building calculates the KPI the same way over the same months. Both can work on the same platform and still need different things from its data:
| Capability | Data requirements |
| Portfolio dashboards | Consistent units, comparable KPIs, visible data gaps |
| Alerts and FDD (fault detection and diagnostics) | Freshness checks, equipment relationships, command versus status |
| Energy analytics | Meter type, weather data, agreed baselines |
| Predictive maintenance | Quality-assessed history and stable asset identity |
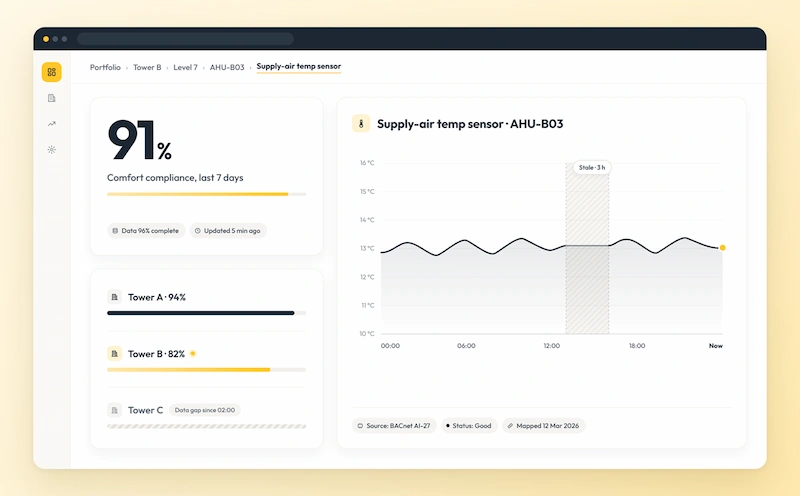
Whether a platform relies on periodic reports or real-time data visualization and reporting, dashboards should show data freshness and quality next to each metric and let users trace a portfolio KPI back to the asset and sensor behind it.
For AI enablement for PropTech, a practical approach is to start with a defined workflow, such as anomaly triage, and evaluate the model against the available equipment history before its output informs operational decisions.
For a facilities technician investigating repeated temperature complaints on Level 7, the value is practical: which equipment serves the affected spaces, whether the readings are current, and whether the issue needs action.
When the platform is integrated with property management software and maintenance systems, a validated fault can reach the responsible team with the relevant readings attached, as an automatic work order or for review, depending on operating rules.
How to Keep Building Data Reliable as the Platform Grows
A pipeline that works for the first few integrations can become difficult to maintain as the platform adds properties, equipment types, and vendor-specific exceptions.
A working connection is no guarantee of reliable data: firmware updates, controller replacements, and vendor schema changes can alter identifiers, units, or measurement behavior without interrupting the feed. These controls reduce the risk of unexpected changes in reporting behavior:
| Practice | What it protects against |
| Onboarding templates per building type, with mapping review before go-live | Inconsistent setup between properties |
| Versioned mappings and rules, with reprocessing after corrections | Silent changes to historical data |
| Contract tests on recorded vendor payloads | Unit or schema changes after vendor updates |
| Observability per building: freshness, completeness, suspect share, mapping coverage | Gradual degradation |
| KPI regression checks on reference buildings | Pipeline changes that shift reported results |
| Effective-dated device-to-asset mappings | Broken history after hardware replacement |
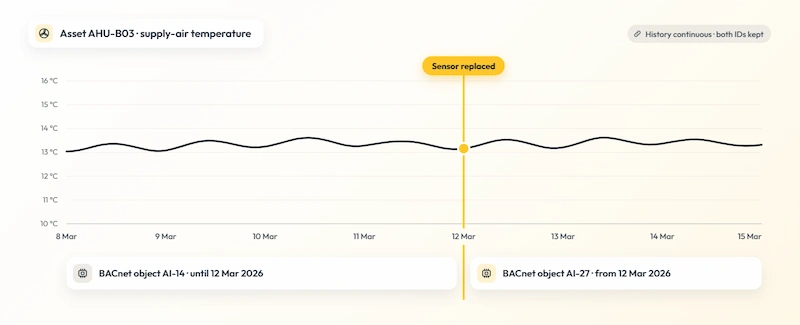
Unresolved points belong in this picture too. When a source point cannot be identified confidently, the platform can keep it in a review queue with its uncertainty recorded. It can then be withheld from features that require confirmed mappings until it has been reviewed.
What Reliable Building Data Changes for the Product
When normalization, building context, and validation are designed into the platform, the effect shows up in day-to-day product work:
- Faster building onboarding: new properties go live through templates and reviewed mappings, with less one-off integration code.
- Less manual repair: fewer mapping and integration fixes after vendor updates or hardware swaps, since changes are versioned and tested.
- More dependable outputs: operational alerts and portfolio analytics that facilities and asset teams can act on with less second-guessing.
Build a Reliable Smart-Building Data and Intelligence Layer
ORIL helps PropTech companies design and build these systems, covering discovery, data architecture, application development, testing, deployment, and ongoing improvement. If you’re developing or scaling a smart-building platform, explore our IoT software development services and discuss your product requirements with our team.


