

Two dashboards, same portfolio, different occupancy numbers. This is the moment most reporting modernization projects start, and it is usually read as a dashboard problem. The tool gets blamed, a replacement gets scoped, and the divergence survives the migration intact.
It survives because it never lived in the dashboard. When occupancy reads 91% on one screen and 94% on another, both tools are usually working correctly. They are faithfully rendering two different calculations of the same concept. The divergence sits several layers down: business logic copied across spreadsheets and SQL scripts, KPIs defined differently by each team, and source systems that were never built to agree on what a lease event means.
That is why swapping one BI tool for another re-renders the same inconsistent data behind a cleaner interface. Reporting that holds up as a portfolio grows depends on the architecture underneath it: a centralized data foundation, governed metric definitions, and cloud-native data engineering that turns operational records into figures executives can act on. That work is software engineering, and scoping it as a dashboard purchase is where modernization budgets get spent twice.

Key takeaways
- In institutional real estate, reporting problems usually originate one layer below the dashboard, in fragmented data architecture and duplicated business logic.
- An enterprise analytics platform models each investment, asset, lease, and financial event once, governs the definitions centrally, and serves them consistently to every report, analyst, and downstream system.
- The same architecture is what makes reliable AI possible later. Governed data comes first, and the copilot comes after.
Why Legacy Reporting Is Becoming a Business Risk
At a small portfolio, spreadsheet-and-SQL reporting is usually manageable. The cost of its limitations is distributed across a few analysts and absorbed as routine overhead. Each acquisition may change that math. A new asset arrives with its own PMS instance, its own chart of accounts, and its own way of recording the same events, and someone has to reconcile it before it reaches a board deck.
The pattern this creates is not organization-specific. In Gartner’s research, inconsistency of data across sources ranks as the most challenging data quality problem, the direct result of data maintained in silos with overlaps and gaps.
That is precisely the condition a growing real estate portfolio produces: financial, leasing, accounting, and valuation systems that each hold a version of the truth and were never designed to agree.
The failure mode is rarely a crash. It is a slow erosion of confidence in the numbers, and it shows up in predictable ways:
- Board reporting slips, because reconciliation is still manual.
- New assets take weeks to appear in portfolio views, because onboarding them means writing bespoke SQL.
- Executives spend more time validating figures than deciding on them.
Left unaddressed, inconsistent reporting logic quietly compounds PropTech data debt, skewing the valuation and performance metrics that acquisitions depend on.
The cost is measurable once it is added up. Gartner has estimated poor data quality costs organizations an average of at least $12.9 million a year.
More recent IBM Institute for Business Value research found that over a quarter of organizations lose more than $5 million annually to poor data quality, and 7% report losses of $25 million or more. For a real estate investment firm, that cost surfaces as delayed acquisitions, slower investment committee decisions, and reporting effort that scales with every asset added rather than staying flat.
How Reporting Usually Evolves and Where It May Break
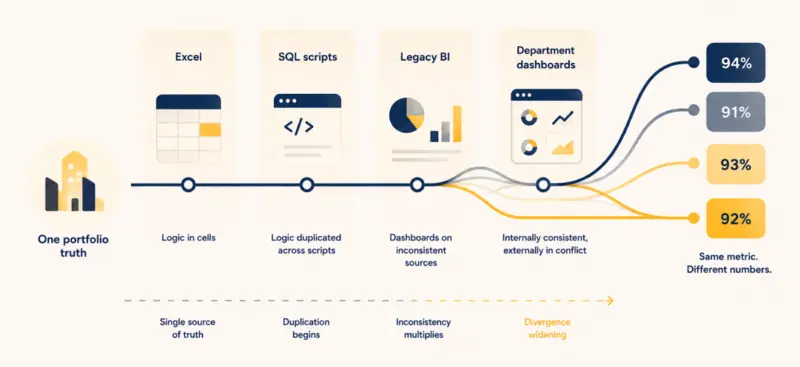
The path is consistent enough to be recognizable across most firms:
- Excel. Fast to start, owned by whoever built the workbook. Business logic lives inside cells.
- SQL scripts. Analysts write queries to pull directly from source databases. Logic is now duplicated across dozens of scripts, each maintained by an individual.
- Legacy or off-the-shelf BI. Dashboards get layered on top, but they read from the same inconsistent sources, so they inherit the inconsistencies.
- Department dashboards. Finance, asset management, and acquisitions each build their own. Every team is now internally consistent and externally in conflict.
Each step adds capability without addressing the underlying architecture, which is why growth eventually forces the move toward dedicated real estate data platforms. The complexity being managed is definitional, not visual.
Dashboards Expose Data Problems, They Don’t Fix Them
A dashboard is a rendering layer. It can only show what the data underneath it already contains. When occupancy reads 91% on one screen and 94% on another, the tool is working correctly. It is faithfully displaying two different calculations of the same concept.
Consider a single portfolio metric and where it splits:
| Metric | Where it’s calculated | Why numbers diverge |
| Occupancy | PMS, asset management workbook, leasing report | Physical vs. economic occupancy; treatment of down units and model apartments differs by team |
| NOI | Accounting system, FP&A model, investor report | Different rules for capex vs. opex, management fees, and non-recurring items |
| IRR | Deal model, fund performance system | Gross vs. net of fees; different cash flow timing assumptions |
No visualization tool resolves this, because the disagreement exists before the data reaches the chart. Replacing the BI layer alone re-creates the same three answers in a new interface. Before locking an architecture into any vendor, it’s worth reviewing the criteria for choosing the right BI tool to see where off-the-shelf software stops and platform engineering has to begin.
The Hidden Cost of Excel, SQL Scripts, and Legacy BI
The cost of legacy reporting is easy to underestimate because it never appears as a single line item. It is distributed across teams, systems, and time, which is part of what makes it dangerous. Broken into categories, it becomes concrete:
| Cost category | What it looks like in a real estate firm |
| Engineering maintenance | Individual analysts maintaining dozens of SQL scripts; logic duplicated across every report |
| Manual reconciliation | Finance and asset management reconciling conflicting NOI and occupancy figures before each board cycle |
| Key-person dependency | Reporting that only one analyst fully understands, creating risk when they leave |
| Delayed decisions | Acquisitions and investment committee sign-offs waiting on reports that take weeks to assemble |
| Compliance and audit risk | LP and regulatory reporting that can’t be traced back to a governed, auditable source |
These costs scale with the portfolio. At ten assets, the overhead is absorbed as routine work. At a hundred, it becomes structural, and the reporting function grows headcount just to stay in place.
What a Modern Real Estate Analytics Platform Looks Like
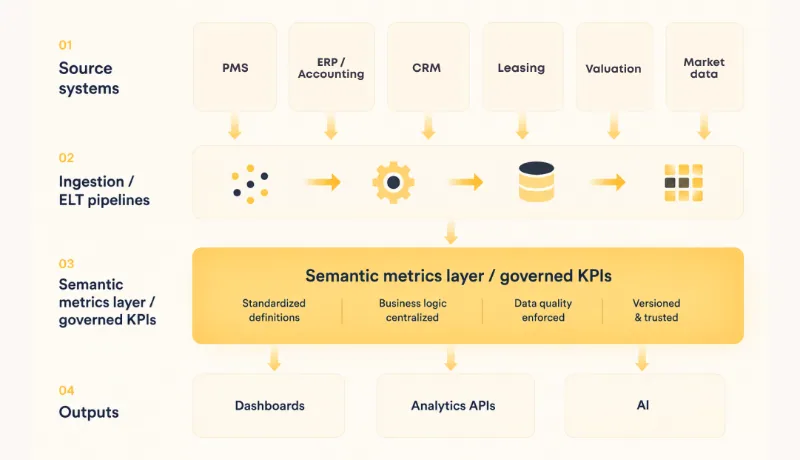
An enterprise analytics platform is the layer between operational systems and everyone who consumes numbers from them. Instead of each report reaching into source systems and applying its own logic, the platform ingests data once, models it into consistent business entities, calculates governed metrics centrally, and serves them through a common interface to dashboards, analysts, investors, and AI systems.
The distinction that matters: the platform becomes the governed analytical layer, rather than forcing every dashboard to calculate metrics independently from source systems. Achieving that at portfolio scale, with real estate’s schema complexity, is where custom analytics platform development tends to outperform a configured off-the-shelf stack. It has four working parts.
Centralize the Data First
The foundation ingests from every system that holds a piece of the portfolio’s truth:
- PMS platforms (Yardi, MRI, RealPage, AppFolio)
- The accounting and ERP layer
- CRM and leasing systems
- Valuation providers and market intelligence feeds
- The spreadsheets that still hold data no system formally owns
Cloud-native ELT pipelines land this data in a warehouse or lakehouse, then transform it into standardized entities: canonical representations of assets, leases, transactions, and financial events that can be reconciled across source systems.
This normalization step is the one most often underestimated. Reliable reporting hinges on well-executed real estate data integration, because a metric can only be governed once the entity beneath it is consistent.
For firms with brokerage or listing exposure, the same principle applies at the feed level, where normalizing MLS data into a unified schema has to happen before any analytical query runs against it.
Define Every Metric Once
A semantic layer, sometimes called a metrics layer, is where a business concept is defined once and reused everywhere. “NOI,” “economic occupancy,” and “portfolio IRR” each get a governed, versioned definition for the intended reporting context.
The effect is consistency by default:
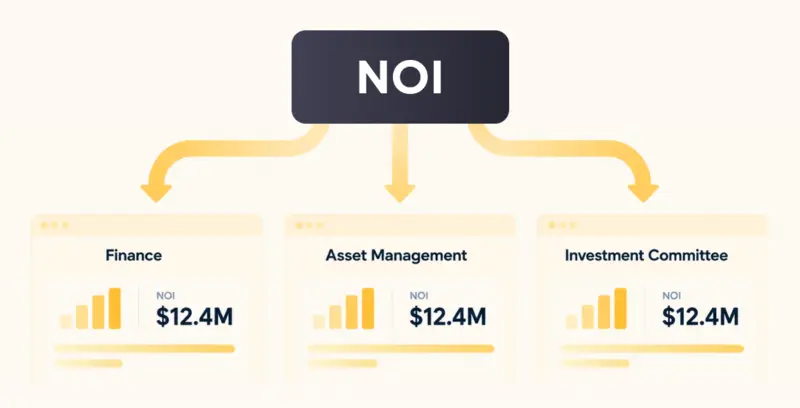
- Finance, asset management, and the investment committee all ask for NOI and receive the same number, with the same rules applied.
- Change a definition in the governed layer, and downstream reports can inherit the updated logic without duplicating the calculation across dozens of reports.
This is the layer that most directly addresses the “three truths for one metric” problem, and it is the part off-the-shelf BI tools are less equipped to handle on their own.
Visualization: The Decision Surface
Once metrics are governed, visualization stops introducing new discrepancies and starts serving decisions. For an investment team, the platform’s value is not the clean data underneath. It is the ability to see portfolio status, spot a deviation, and act on it in the same sitting. The bar here is higher than a set of attractive dashboards. Investment and operating decisions happen at a specific level of detail, and the visualization layer has to reach it. In practice, that means views that let a team:
- Drill down from portfolio to property to unit or lease
- See variances and compare actual against budget
- Compare assets and surface the outliers
- Track trends and monitor acquisition performance
- Read every KPI in a single governed context, so the numbers mean the same thing across every view
The design goal is decision support: surfacing the anomaly that needs attention before it reaches a board deck. Building interfaces that hold up against a live portfolio, with role-based views, drill-down performance, and geospatial rendering at scale, is an engineering problem as much as a design one, which is why real estate data visualization is worth treating as its own discipline rather than a default template.
Cloud-Native Architecture That Scales
A well-designed cloud-native architecture can make onboarding the next acquisition more repeatable without requiring a rebuild. In practice, that comes down to a few engineering choices:
- Separate storage from compute, so each scales independently.
- Orchestrate pipelines as code, so a new asset or fund is a configuration task, not a re-engineering project.
- Manage the platform through infrastructure-as-code, so environments are repeatable and auditable.
Elastic compute then handles month-end and board-cycle load without standing infrastructure sized for the peak. That elasticity is what keeps reporting stable as the portfolio grows.
From Reporting to Investment Intelligence
Once business logic is centralized and governed, the platform stops being a reporting utility and starts supporting decisions directly.
The same governed metrics feed:
- Investment committee memos
- Acquisition underwriting
- Portfolio benchmarking across regions
- Forecasting
- LP reporting
All draw from one consistent model rather than from separately reconciled extracts.
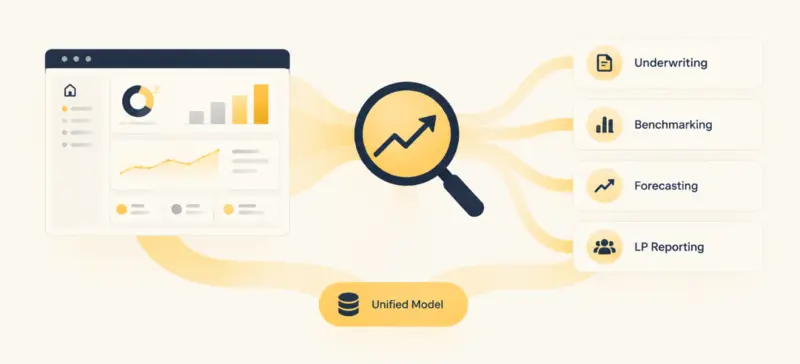
The practical shift is speed and trust at the point of decision. Because every figure resolves to the same governed definition, an executive view can move from portfolio-level performance down to a single underperforming asset without the numbers changing meaning along the way.
Due diligence on a new acquisition draws from the same entity model the rest of the portfolio uses, so a new asset can be benchmarked against the existing portfolio as soon as its data is onboarded and mapped to the common entity model. Regional offices stop calculating KPIs their own way, so portfolio comparisons hold up under scrutiny. The advantage an investment team feels day to day is less about faster reports and more about a portfolio view they can trust enough to act on.
How AI Depends on Modern Analytics Architecture
AI in investment analytics is an outcome of mature data architecture rather than a shortcut around it. An executive copilot answering “what’s our same-store NOI growth this quarter?” is only as reliable as the metric definition it calls. Point a language model at fragmented sources without governed retrieval and metric definitions, and it can produce inconsistent interpretations of ‘occupancy’ or ‘stabilized’, reproducing the inconsistency problem at machine speed.
The data supports treating readiness as the gating factor. Gartner predicts that through 2026, organizations will abandon 60% of AI projects that are not supported by AI-ready data. In IBM’s research, nearly half of executives cite data inaccuracies and bias as a barrier to adopting AI. The obstacle is rarely the model. It is the state of the data feeding it.
A governed analytics platform is what closes that gap. Once metrics are defined once and historical data carries clear lineage, AI has a foundation it can trust. That foundation makes the following dependable:
- Natural language portfolio queries that return governed numbers
- Predictive occupancy and NOI forecasting grounded in consistent historical data
- Acquisition opportunity scoring against a uniform entity model
- Scenario simulation that holds up because the inputs agree
Predictive and generative use cases realistically require data-native PropTech platforms that keep data clean and governed as it flows. It is the reason AI pilots built on ungoverned historical data so often stall in validation, well before they reach production.
A Practical Modernization Roadmap for Legacy Reporting
Modernization works best incrementally. A full rip-and-replace stalls, but a sequenced approach delivers trusted metrics in stages while the legacy reports keep running.
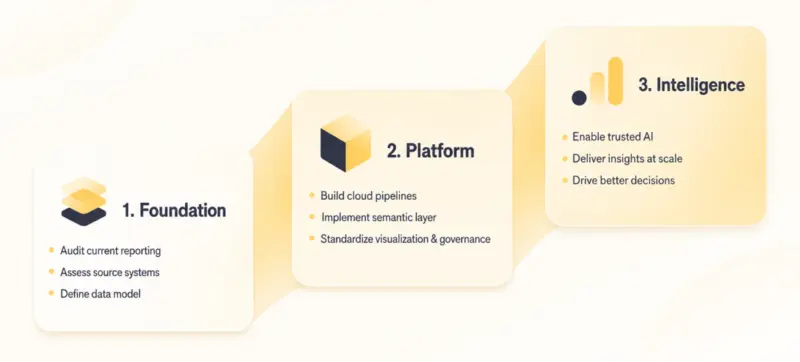
- Reporting and KPI audit. Catalog every report in production and every metric definition in use. This surfaces the definitional conflicts before any code is written.
- Source system assessment. Map what each system holds, its data quality, and how it exposes data.
- Enterprise data model. Design the canonical entities: asset, lease, transaction, financial event, fund.
- Cloud architecture and pipelines. Stand up the warehouse or lakehouse and build the ingestion and transformation layer.
- Semantic metrics layer. Implement governed KPIs as versioned, reusable logic.
- Visualization and governance. Build the decision interfaces on top, with lineage, data quality monitoring, and access control in place from the start.
- AI enablement. Layer predictive and conversational capabilities once the governed foundation is proven.
Teams executing backend migrations under this sequence can draw on established practices for revamping legacy applications to avoid reporting downtime during the transition. Where an interim internal dashboard is needed before the full platform lands, low-code admin platforms can serve as an efficient bridge rather than a permanent layer.
How ORIL Builds Enterprise Analytics Platforms for Real Estate Investors
ORIL approaches reporting modernization as platform engineering that carries through to the executive views investment teams actually work from. Depending on the existing architecture, data maturity, and business priorities, the work may involve a combination of:
- Discovery of the existing metric definitions and source systems, surfacing where KPIs conflict today
- Canonical data modeling, where appropriate, to create consistent representations of assets, leases, transactions, and financial events across the portfolio
- Cloud-native pipeline development for reliable ingestion and transformation at scale
- A governed semantic layer, where each metric is defined once and served everywhere
- Analytics services and executive visualization that turn governed metrics into portfolio, asset, and operational decision interfaces.
AI readiness can emerge as an outcome of this architecture rather than a separate initiative bolted on afterward. The emphasis is on establishing business logic in a maintainable, governed layer and making it consistently available across reporting, analytics, and downstream applications. This allows the platform to support new assets and funds through a more repeatable onboarding process rather than requiring a rebuild each time.
That focus on the full path from source data to the executive view is central to how ORIL’s real estate software development experience supports institutional investors modernizing their analytics infrastructure at scale. The aim is not to produce more dashboards. It is to turn fragmented real estate data into portfolio intelligence that teams can understand, govern, and act on at the level where investment and operating decisions are actually made.
Better Architecture Comes Before Better Dashboards
Issues discussed in this article trace to the same engineering root. Conflicting occupancy figures, board reports that take weeks to reconcile, acquisitions that stall in due diligence, AI pilots that fail in validation. None of these are reporting problems in the way they first appear. They are symptoms of business logic scattered across spreadsheets and individual SQL scripts, with no single place where a metric is defined and governed.
Moving that logic into a centralized platform is what resolves them together. When each metric is defined once, modeled on a consistent entity, and served from a governed semantic layer, reporting holds together across teams, new assets onboard far faster, and AI has a foundation it can trust.
This is engineering work, and it rewards a partner who has done it before. ORIL builds these platforms the way the problem demands: canonical data models, cloud-native pipelines, and a governed metrics layer engineered to absorb the next acquisition rather than requiring a rebuild each time. Scoped as the software engineering effort it is, and delivered in stages, reporting modernization produces trusted numbers early and a foundation that holds as the portfolio grows.


